Perform a Model Comparison
From the toolbar, click the  icon to create a new model comparison. The Model
Comparison window appears.
icon to create a new model comparison. The Model
Comparison window appears.
icon to create a new model comparison. The Model
Comparison window appears.
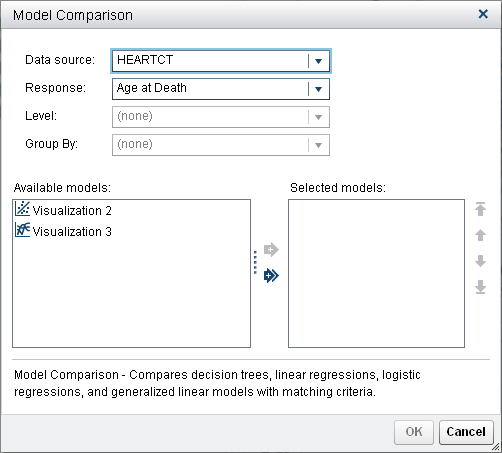
The Response variable
is already set to Age at Death, and Level and Group
By are unavailable. With these settings, the available
models are Visualization 2 (the Linear Regression)
and Visualization 3 (the Generalized Linear
Model). Click the  to select both models for comparison. Click OK.
to select both models for comparison. Click OK.
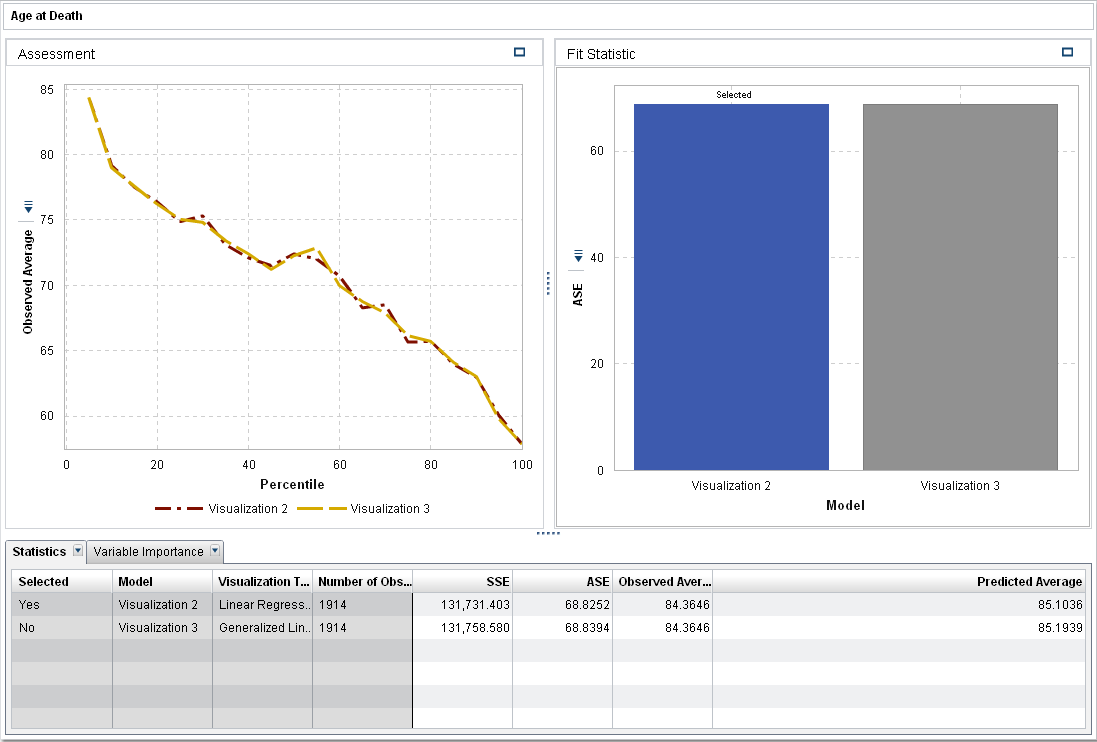
By default, the fit statistic average squared error ASE is used to compare the models. The other available fit statistics are SSE and Observed
Average. Because smaller values are preferred, the Linear
Regression is chosen as the champion when ASE or SSE is
the criterion. The models are very similar.
When the fit statistic
is Observed Average, the Percentile slider is available. This slider specifies the percentile where the observed average and predicted average are compared. In some percentiles, the Generalized Linear Model might be chosen over the Linear Regression.
If you view the Assessment plot, both the Observed Average and Predicted
Average plots show that the models are relatively similar.
Now that you have a champion model, you can export the model score code for that model to score new data.

Copyright © SAS Institute Inc. All rights reserved.