Create a Linear Regression
From the toolbar, click the  icon next to the
  icon. Select Linear Regression from the drop-down list. Minimize the Decision Tree visualization and Tree
Overview window.
icon. Select Linear Regression from the drop-down list. Minimize the Decision Tree visualization and Tree
Overview window.
icon next to the icon. Select Linear Regression from the drop-down list. Minimize the Decision Tree visualization and Tree
Overview window.
In this example, the
variable of interest is Age at Death, which
should be the first variable listed in the Measure section
of the Data pane. Because you want this variable to be the response variable, click, drag, and drop Age
at Death from the Data pane
onto the model pane. Notice that Age at Death now
appears in the Response field on the Roles tab.
The next step is to choose the effect variables or interaction terms that you want
to include in the analysis. One option is to make every available variable an effect
variable and let SAS Visual Statistics perform variable selection. However, this is not always feasible from a computational resources perspective. This example creates an interaction term to use as an effect
variable and includes a few other variables as effect variables.
Because you suspect
that systolic blood pressure and diastolic blood pressure interact
with each other, create an interaction term for these variables. In
the Data pane, click the  icon, and select New Interaction Effect.
In the New Interaction Effect window, move Diastolic and Systolic from
the Available columns area into the Effect
elements area. Click Create.
The interaction term Diastolic*Systolic appears
in the Interaction Effects group of the Data pane.
icon, and select New Interaction Effect.
In the New Interaction Effect window, move Diastolic and Systolic from
the Available columns area into the Effect
elements area. Click Create.
The interaction term Diastolic*Systolic appears
in the Interaction Effects group of the Data pane.
icon, and select New Interaction Effect.
In the New Interaction Effect window, move Diastolic and Systolic from
the Available columns area into the Effect
elements area. Click Create.
The interaction term Diastolic*Systolic appears
in the Interaction Effects group of the Data pane.
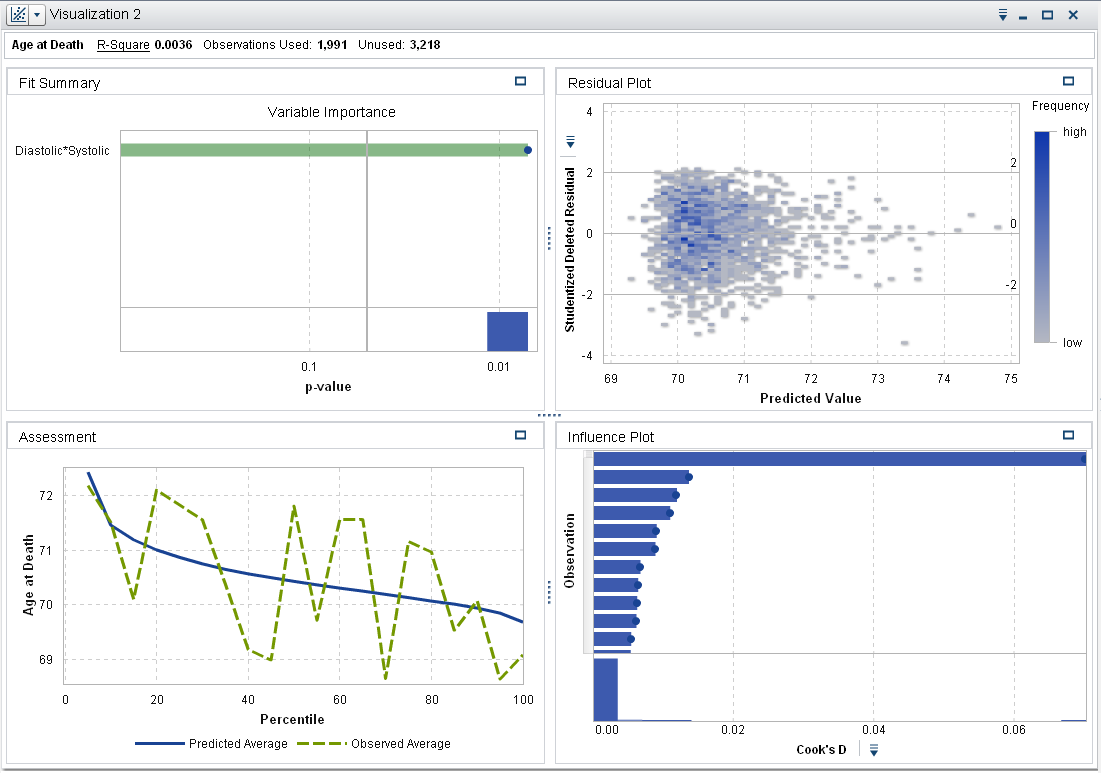
Click, drag, and drop Diastolic*Systolic onto
the model pane. A model is created based on that single effect because
the Auto-update model option is selected in the right pane. Each time a change is made to the model, the
Linear Regression automatically updates. If you anticipate making many changes or
if you are experiencing server performance issues, deselect the Auto-update
model option. When auto-updates are disabled, you must
click Update in the right pane to update
the model.
Next, add more effects
to the model. Hold down the Ctrl key, and select Blood
Pressure Status, Cause of Death, Leaf
ID 1, Sex, Smoking
Status, Cholesterol, Height, Smoking,
and Weight. Drag and drop these variables
onto the model pane. The Linear Regression updates to include these
effects.
In the right pane, select
the Properties tab. In this model, Informative
missingness and Use variable selection are
not selected. Disabling Informative missingness means that observations with missing values are not included in the analysis. Disabling Use variable selection means that
all variables are used in the model, regardless of how significant
they are to the model. For this model, keep the default properties
settings.
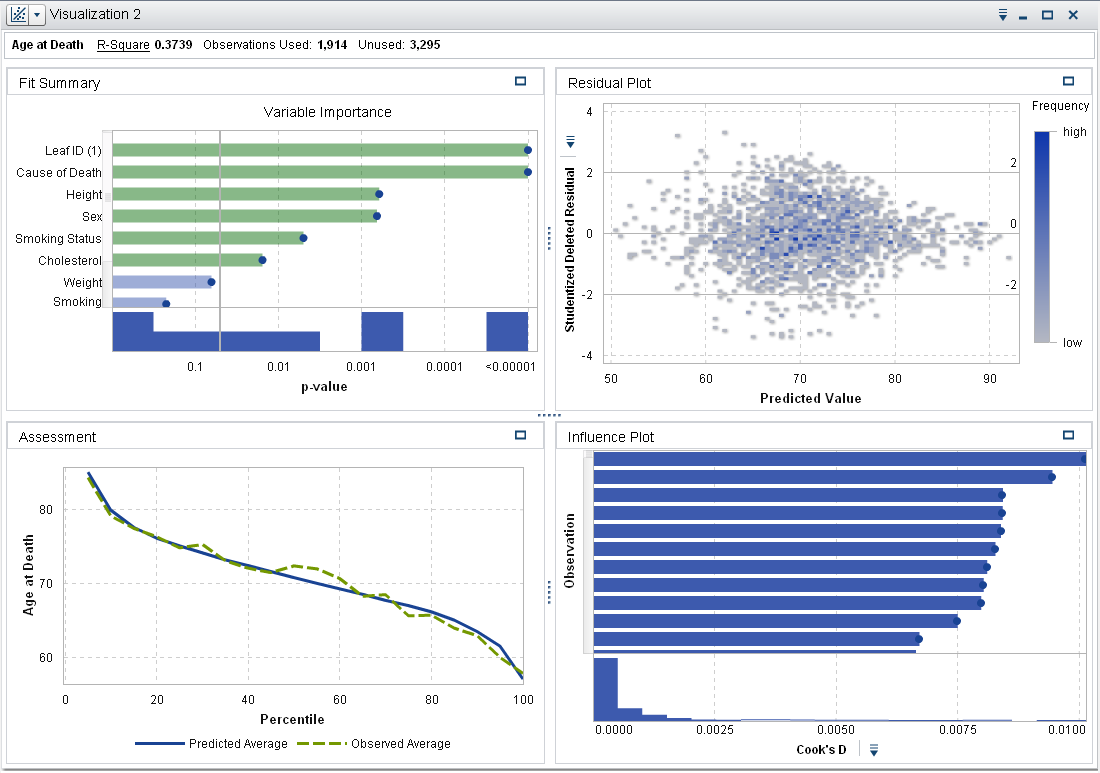
The Fit
Summary window indicates that Cause of Death, Leaf
ID (1), and Height are the three
most important effects in this model.
The Assessment window indicates that the observed average and predicted average are approximately
equal for most bins.
Save the project.
Copyright © SAS Institute Inc. All rights reserved.