| Changing the Color and Shape of Observation Markers |
Showing Only Selected Observations
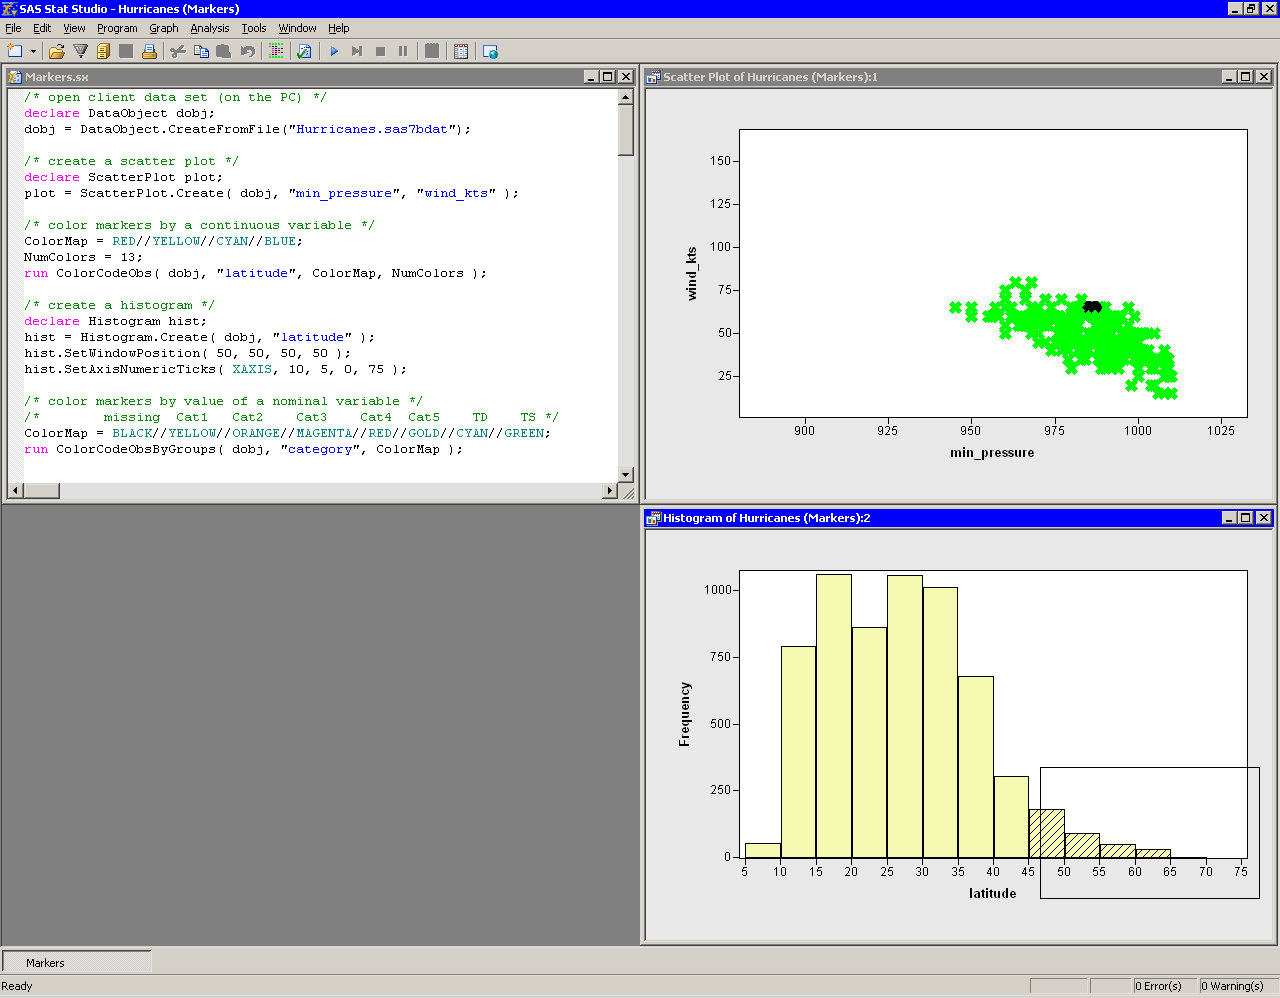
A technique that is sometimes useful for exploring data is to show
only observations that are selected.
For example, suppose you are
trying to understand how the wind_kts and min_pressure
variables are distributed, given specific values for the
latitude variable. Add the following statement at the bottom of the
program window, and select Program ![]() Run from the main
menu.
Run from the main
menu.
plot.ShowObs( false );
The scatter plot now displays only selected observations as shown in
Figure 10.5. You can select bars in the histogram
and examine how the wind speed and atmospheric pressure of storms vary
as storms move from lower latitudes to higher latitudes. You can
immediately see that storms at or above ![]() tend to be weaker storms
without well-developed eyes.
tend to be weaker storms
without well-developed eyes.
|
Figure 10.5: Showing Only Selected Observations
Copyright © 2008 by SAS Institute Inc., Cary, NC, USA. All rights reserved.