| Introduction |
What Is Stat Studio?
Stat Studio is a tool for data exploration and analysis. Stat Studio requires that you have a license for Base SAS, SAS/STAT, and SAS/IML. Stat Studio runs on a PC in the Microsoft Windows operating environment. You can use Stat Studio to do the following:
- explore data through graphs linked across multiple windows
- transform data
- subset data
- analyze univariate distributions
- discover structure and features in multivariate data
- fit and evaluate explanatory models
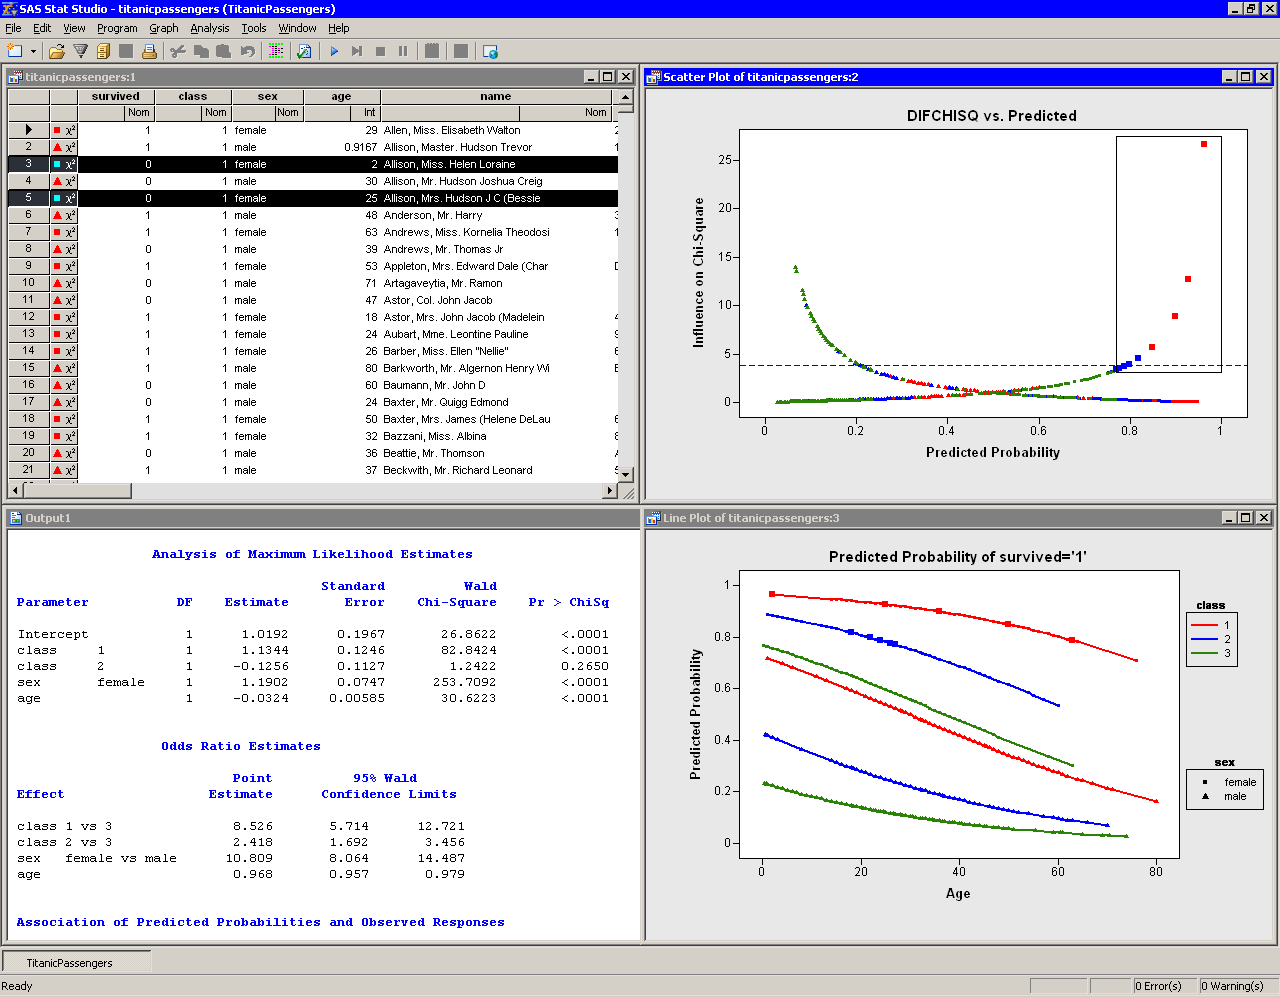
Figure 1.1 shows the Stat Studio interface with a logistic model for the probability of a passenger surviving the 1912 Titanic disaster. The figure shows output from the LOGISTIC procedure and three linked views of the data: a data table, a diagnostic plot that uses the DIFCHISQ statistic to identify observations that do not fit the model well, and a line plot that shows the predicted probability of survival as a function of a passenger's age, gender, and cabin class (first class, second class, or third class). Observations that are selected in the diagnostic plot are shown as selected in all other (graphical and tabular) views of the data. The shapes and colors of observations are also shared among all views of the data.
Figure 1.1 was created using only the Stat Studio graphical user interface (GUI). While the GUI provides powerful tools for analyzing data, you can also extend Stat Studio's built-in abilities by writing programs. Stat Studio provides an integrated development environment that enables you to write, debug, and execute programs that combine the following:
- the flexibility of the SAS/IML matrix language
- the analytical power of SAS/STAT
- the data manipulation capabilities of Base SAS
- the dynamically linked graphics of Stat Studio
|
Figure 1.1: The Stat Studio Interface
The programming language in Stat Studio, which is called IMLPlus , is an enhanced version of the IML programming language. The "Plus" part of the name refers to new features that extend the IML language, including the ability to create and manipulate statistical graphics and to call SAS procedures.
This book does not require previous knowledge of IML. The emphasis in this book is on the "Plus" part of the IMLPlus language.
Copyright © 2008 by SAS Institute Inc., Cary, NC, USA. All rights reserved.