The SURVEYMEANS Procedure

Example 112.2 Domain Analysis
Suppose that you are studying profiles of 800 top-performing companies to provide information about their impact on the economy. You are also interested in the company profiles within each market type. A sample of 66 companies is selected with unequal probability across market types. However, market type is not included in the sample design. Thus, the number of companies within each market type is a random variable in your sample. To obtain statistics within each market type, you should use domain analysis. The data of the 66 companies are saved in the following data set:
data Company;
   length Type $14;
   input Type$ Asset Sale Value Profit Employee Weight;
   datalines;
Other            2764.0  1828.0  1850.3   144.0   18.7   9.6
Energy          13246.2  4633.5  4387.7   462.9   24.3  42.6
Finance          3597.7   377.8    93.0    14.0    1.1  12.2
Transportation   6646.1  6414.2  2377.5   348.2   47.1  21.8
HiTech           1068.4  1689.8  1430.2    72.9    4.6   4.3
Manufacturing    1125.0  1719.4  1057.5    98.1   20.4   4.5
Other            1459.0  1241.4   452.7    24.5   20.1   5.5
Finance          2672.3   262.5   296.2    23.1    2.2   9.3
Finance           311.0   566.2   932.0    52.8    2.7   1.9
Energy           1148.6  1014.6   485.1    60.6    4.0   4.5
Finance          5327.0   572.4   372.9    25.2    4.2  17.7
Energy           1602.7   678.4   653.0    75.6    2.8   6.0
Energy           5808.8  1288.4  2007.0   318.8    5.9  19.2
Medical           268.8   204.4   820.9    45.6    3.7   1.8
Transportation   5222.6  2627.8  1910.0   245.6   22.8  17.4
Other             872.7  1419.4   939.3    69.7   12.2   3.7
Retail           4461.7  8946.8  4662.7   289.0  132.1  15.0
HiTech           6719.2  6942.0  8240.2   381.3   85.8  22.1
Retail            833.4  1538.8  1090.3    64.9   15.4   3.5
Finance           415.9   167.3  1126.8    56.8    0.7   2.2
HiTech            442.4  1139.9  1039.9    57.6   22.7   2.3
Other             801.5  1157.0   664.2    56.9   15.5   3.4
Finance          4954.8   468.8   366.4    41.7    3.0  16.5
Finance          2661.9   257.9   181.1    21.2    2.1   9.3
Finance          5345.8   530.1   337.4    36.4    4.3  17.8
Energy           3334.3  1644.7  1407.8   157.6    6.4  11.4
Manufacturing    1826.6  2671.7   483.2    71.3   25.3   6.7
Retail            618.8  2354.7   767.7    58.6   19.0   2.9
Retail           1529.1  6534.0   826.3    58.3   65.8   5.7
Manufacturing    4458.4  4824.5  3132.1    28.9   67.0  15.0
HiTech           5831.7  6611.1  9464.7   459.6   86.7  19.3
Medical          6468.3  4199.2  3170.4   270.1   59.5  21.3
Energy           1720.7   473.1   811.1    86.6    1.6   6.3
Energy           1679.7  1379.9   721.1    91.8    4.5   6.2
Retail           4018.2 16823.4  2038.3   178.1  162.0  13.6
Other             227.1   575.8  1083.8    62.6    1.9   1.6
Finance          3872.8   362.0   209.3    27.6    2.4  13.1
Retail           3359.3  4844.7  2651.4   224.1   75.6  11.5
Energy           1295.6   356.9   180.8   162.3    0.6   5.0
Energy           1658.0   626.6   688.0   126.0    3.5   6.1
Finance         12156.7  1345.5   680.7   106.6    9.4  39.2
HiTech           3982.6  4196.0  3946.8   313.9   64.3  13.5
Finance          8760.7   886.4  1006.9    90.0    7.5  28.5
Manufacturing    2362.2  3153.3  1080.0   137.0   25.2   8.4
Transportation   2499.9  3419.0   992.6    47.2   25.3   8.8
Energy           1430.4  1610.0   664.3    77.7    3.5   5.4
Energy          13666.5 15465.4  2736.7   411.4   26.6  43.9
Manufacturing    4069.3  4174.7  2907.6   289.2   38.2  13.7
Energy           2924.7   711.9  1067.8   146.7    3.4  10.1
Transportation   1262.1  1716.0   364.3    71.2   14.5   4.9
Medical           684.4   672.9   287.4    61.8    6.0   3.1
Energy           3069.3  1719.0  1439.0   196.4    4.9  10.6
Medical           246.5   318.8   924.1    43.8    3.1   1.7
Finance         11562.2  1128.5   580.4    64.2    6.7  37.3
Finance          9316.0  1059.4   816.5    95.9    8.0  30.2
Retail           1094.3  3848.0   563.3    29.4   44.7   4.4
Retail           1102.1  4878.3   932.4    65.2   47.3   4.4
HiTech            466.4   675.8   845.7    64.5    5.2   2.4
Manufacturing   10839.4  5468.7  1895.4   232.8   47.8  35.0
Manufacturing     733.5  2135.3    96.6    10.9    2.7   3.2
Manufacturing   10354.2 14477.4  5607.2   321.9  188.5  33.5
Energy           1902.1  2697.9   329.3    34.2    2.2   6.9
Other            2245.2  2132.2  2230.4   198.9    8.0   8.0
Transportation    949.4  1248.3   298.9    35.4   10.4   3.9
Retail           2834.4  2884.6   458.2    41.2   49.8   9.8
Retail           2621.1  6173.8  1992.7   183.7  115.1   9.2
;
For each company in your sample, the variables are defined as follows:
-
Typeidentifies the type of market for the company. -
Assetcontains the company’s assets, in millions of dollars. -
Salecontains sales, in millions of dollars. -
Valuecontains the market value of the company, in millions of dollars. -
Profitcontains the profit, in millions of dollars. -
Employeecontains the number of employees, in thousands. -
Weightcontains the sampling weight.
The following SAS statements use PROC SURVEYMEANS to perform the domain analysis, estimating means, and other statistics for
the overall population and also for the subpopulations (or domain) defined by market type. The DOMAIN statement specifies
Type as the domain variable:
ods graphics on;
title 'Top Companies Profile Study';
proc surveymeans data=Company total=800 mean sum;
   var Asset;
   weight Weight;
   domain Type;
run;
Output 112.2.1 shows that there are 66 observations in the sample. The sum of the sampling weights equals 799.8, which is close to the total number of companies in the study population.
Output 112.2.1: Company Profile Study
The "Statistics" table in Output 112.2.1 displays the estimates of the mean and total for all analysis variables for the entire set of 800 companies, while Output 112.2.2 shows the mean and total estimates for each company type.
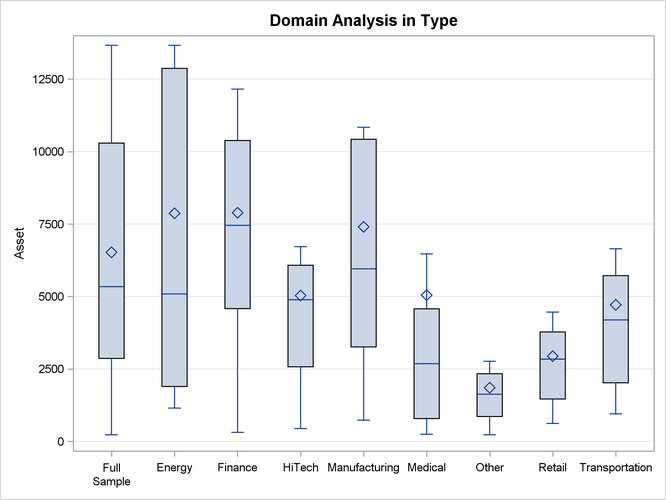
When ODS Graphics is enabled, PROC SURVEYMEANS also displays Output 112.2.3, which depicts the domain statistics for each company type in addition to the statistics in the full sample.
Output 112.2.2: Domain Analysis for Company Profile Study
| Top Companies Profile Study |
| Domain Statistics in Type | |||||
|---|---|---|---|---|---|
| Type | Variable | Mean | Std Error of Mean | Sum | Std Error of Sum |
| Energy | Asset | 7868.302932 | 1941.699163 | 1449341 | 785962 |
| Finance | Asset | 7890.190264 | 1057.185336 | 1855773 | 704506 |
| HiTech | Asset | 5031.959781 | 732.436967 | 321542 | 183302 |
| Manufacturing | Asset | 7403.004250 | 1454.921083 | 888361 | 492577 |
| Medical | Asset | 5046.570609 | 1218.444638 | 140799 | 131942 |
| Other | Asset | 1850.250000 | 338.128984 | 58838 | 31375 |
| Retail | Asset | 2939.845750 | 393.692369 | 235188 | 94605 |
| Transportation | Asset | 4712.047359 | 888.954411 | 267644 | 163516 |
Output 112.2.3: Domain Analysis for Company Profile Study