Statistical Graphics Using ODS
Example 21.2 Creating Graphs for a Presentation
The RTF destination provides an easy way to create graphs for inclusion in a paper or presentation. You can specify the ODS RTF statement to create a file that is easily imported into a document (such as Microsoft Word or WordPerfect) or a presentation (such as Microsoft PowerPoint).
The following statements request a loess fit and save the output in the file loess.rtf:
ods _all_ close;
ods rtf file="loess.rtf" style=HTMLBlue;
ods graphics on;

proc loess data=sashelp.enso;
   model pressure = year / clm residual;
run;

ods rtf close;
ods listing;
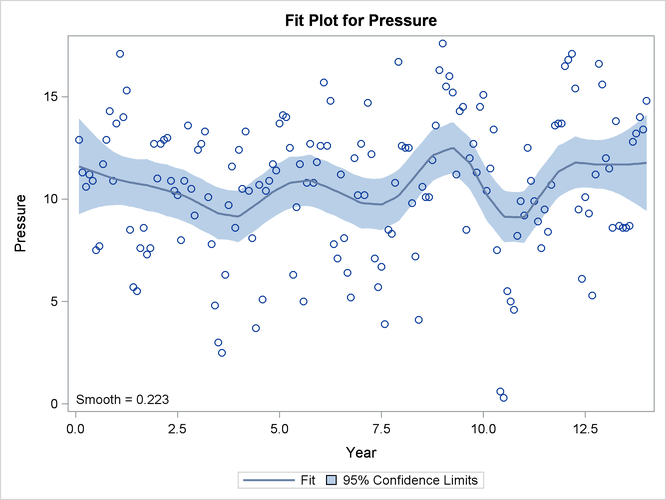
The output file includes various tables and the following plots: a plot of the selection criterion versus smoothing parameter,
a fit plot with  confidence bands, a plot of residual by regressors, and a diagnostics panel. The fit plot is produced by using the HTMLBLUE
style and is shown in Output 21.2.1.
confidence bands, a plot of residual by regressors, and a diagnostics panel. The fit plot is produced by using the HTMLBLUE
style and is shown in Output 21.2.1.
Output 21.2.1: Loess Fit Plot with the HTMLBLUE Style
If you are running SAS on the Microsoft Windows operating system, you can open the RTF file in Microsoft Word and simply copy and paste the graphs into Microsoft PowerPoint. In general, RTF output is convenient for exchange of graphical results between Windows applications through the clipboard.
Alternatively, if you use the LISTING or HTML destination, then your individual graphs are created as PNG files by default. You can insert these files in a Microsoft PowerPoint presentation. For information about how the image files are named and saved, see the sections Naming Graphic Image Files and Saving Graphic Image Files.