Statistical Graphics Using ODS
Example 21.1 Creating Graphs with Tooltips in HTML
This example demonstrates how to request graphs in HTML that are enhanced with tooltip displays, which appear when you move a mouse pointer over certain features of the graph. When you specify the HTML destination and IMAGEMAP=ON in the ODS GRAPHICS statement, an image map of coordinates for tooltips is generated along with the HTML output file. Individual graphs are saved as PNG files.
Example 77.2 and Example 77.8 in Chapter 77: The MIXED Procedure, analyze a data set that has repeated growth measurements for 27 children. The following step creates the data set:
data pr;
   input Person Gender $ y1 y2 y3 y4 @@;
   y=y1; Age=8;  output;
   y=y2; Age=10; output;
   y=y3; Age=12; output;
   y=y4; Age=14; output;
   drop y1-y4;
   datalines;
 1  F  21.0  20.0  21.5  23.0      2  F  21.0  21.5  24.0  25.5
 3  F  20.5  24.0  24.5  26.0      4  F  23.5  24.5  25.0  26.5

   ... more lines ...

;
The following statements fit a mixed model that has random intercepts and slopes for each child:
ods _all_ close;
ods html body='b.html' style=HTMLBlue;
ods graphics on / imagemap=on;

proc mixed data=pr method=ml plots=boxplot;
   ods select 'Conditional Residuals by Gender';
   class Person Gender;
   model y = Gender Age Gender*Age;
   random intercept Age / type=un subject=Person;
run;

ods html close;
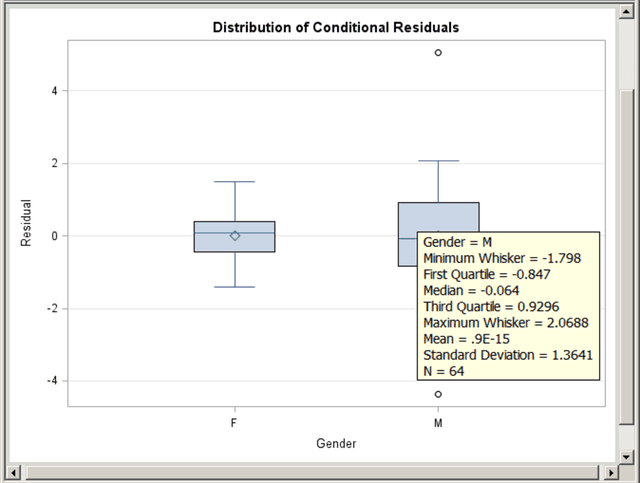
The PLOTS=BOXPLOT option in the PROC MIXED statement requests box plots of observed values and residuals for each classification
main effect in the model (Gender and Person). Only the by-gender box plots are actually created because of the ODS SELECT statement, which uses the plot label to select
the plot. Output 21.1.1 displays the results. Moving the mouse pointer over a box plot displays a tooltip that contains summary statistics for the
class level. Graphics with tooltips are supported for only the HTML destination.
Output 21.1.1: Box Plot with Tooltips