Statistical Graphics Using ODS
Example 21.3 Creating Graphs in PostScript Files
This example illustrates how to create individual graphs in PostScript files. This is particularly useful when you want to include them in a LaTeX document.
The following statements close all open destinations, open the LATEX[12] destination with the JOURNAL style, and request a grouped bar chart for the Sashelp.Class data set:
ods graphics on / reset=index;
ods _all_ close;
ods latex style=Journal;

proc sgplot data=sashelp.class;
   vbar age / group=sex;
run;

ods latex close;
ods listing;
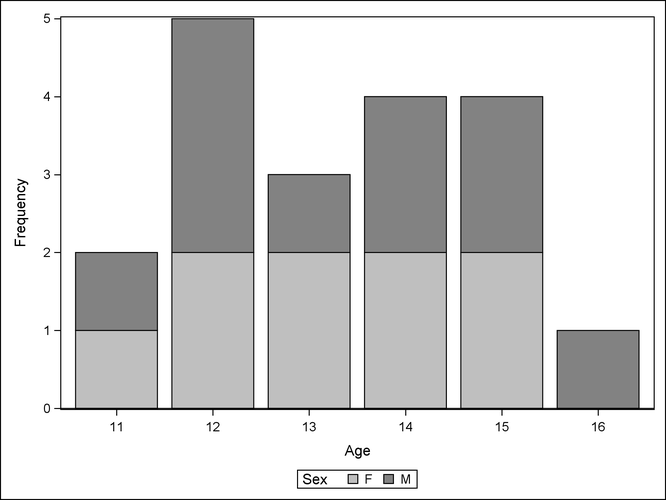
The JOURNAL style displays grayscale graphs that are suitable for a journal. When you specify the ODS LATEX destination, ODS
creates a PostScript file for each individual graph in addition to a LaTeX source file that includes the tabular output and references to the PostScript files. By default, these files are saved in
the SAS current folder. The bar chart shown in Output 21.3.1 is saved by default in a file named SGPlot.ps. For information about how graphic image files are named, see the section Naming Graphic Image Files. If both the default destination (LISTING or HTML) and the LATEX destination are open, then two files are created: SGPlot.png and SGPlot1.ps. If RESET=INDEX is not specified in the ODS GRAPHICS statement and you run the step again, the next names are based on an
incremented index (SGPlot2.png and SGPlot3.ps).
Output 21.3.1: Bar Chart Using the JOURNAL Style
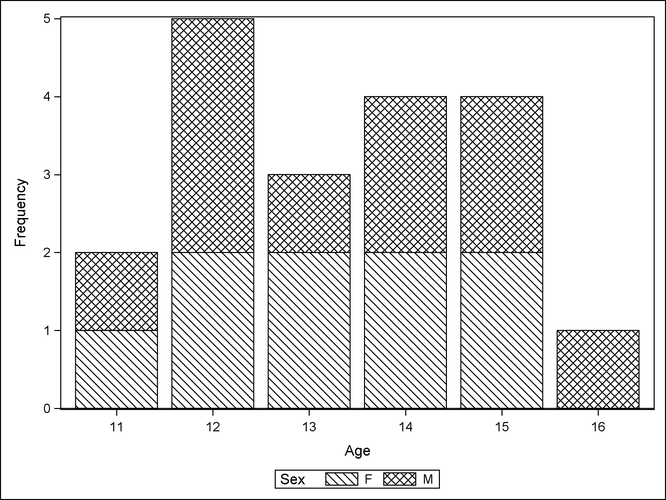
You can use the JOURNAL2 style for a different appearance—the bars are not shaded. Crosshatching is used to indicate group membership. The following step produces Output 21.3.2:
ods graphics on / reset=index;
ods _all_ close;
ods latex style=Journal2;

proc sgplot data=sashelp.class;
   vbar age / group=sex;
run;

ods latex close;
ods listing;
Output 21.3.2: Bar Chart Using the JOURNAL2 Style
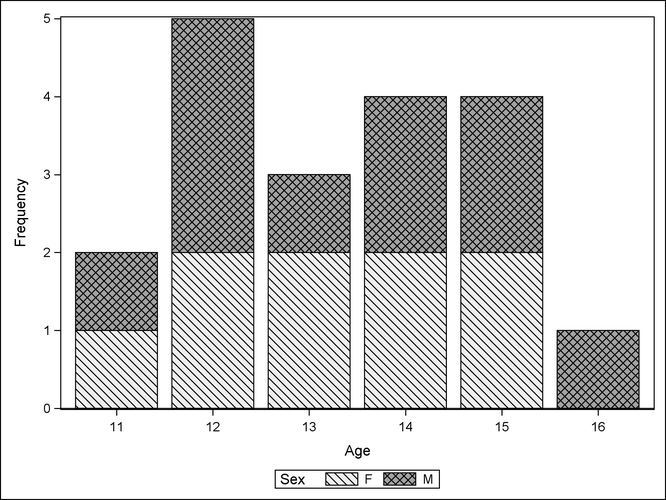
You can use the JOURNAL3 style for a different kind of appearance from the JOURNAL style. A mix of filled areas and crosshatching is used in grouped bar charts. The following step produces Output 21.3.3:
ods graphics on / reset=index;
ods _all_ close;
ods latex style=Journal3;

proc sgplot data=sashelp.class;
   vbar age / group=sex;
run;

ods latex close;
ods listing;
Output 21.3.3: Bar Chart Using the JOURNAL3 Style
If you are writing a paper, you can include the graphs in your own LaTeX source file by referencing the names of the individual PostScript graphics files. In this situation, you might not find it necessary to use the LaTeX source file created by the SAS System. Alternatively, you can include PNG files in a LaTeX document, after using some other ODS destination (such as HTML) to create the PNG files.