The PHREG Procedure
- Overview
-
Getting Started

-
SyntaxPROC PHREG StatementASSESS StatementBASELINE StatementBAYES StatementBY StatementCLASS StatementCONTRAST StatementEFFECT StatementESTIMATE StatementFREQ StatementHAZARDRATIO StatementID StatementLSMEANS StatementLSMESTIMATE StatementMODEL StatementOUTPUT StatementProgramming StatementsRANDOM StatementSTRATA StatementSLICE StatementSTORE StatementTEST StatementWEIGHT Statement
-
DetailsFailure Time DistributionTime and CLASS Variables UsagePartial Likelihood Function for the Cox ModelCounting Process Style of InputLeft-Truncation of Failure TimesThe Multiplicative Hazards ModelProportional Rates/Means Models for Recurrent EventsThe Frailty ModelProportional Subdistribution Hazards Model for Competing-Risks DataHazard RatiosNewton-Raphson MethodFirth’s Modification for Maximum Likelihood EstimationRobust Sandwich Variance EstimateTesting the Global Null HypothesisType 3 TestsConfidence Limits for a Hazard RatioUsing the TEST Statement to Test Linear HypothesesAnalysis of Multivariate Failure Time DataModel Fit StatisticsSchemper-Henderson Predictive MeasureResidualsDiagnostics Based on Weighted ResidualsInfluence of Observations on Overall Fit of the ModelSurvivor Function EstimatorsEffect Selection MethodsAssessment of the Proportional Hazards ModelThe Penalized Partial Likelihood Approach for Fitting Frailty ModelsSpecifics for Bayesian AnalysisComputational ResourcesInput and Output Data SetsDisplayed OutputODS Table NamesODS Graphics
-
ExamplesStepwise RegressionBest Subset SelectionModeling with Categorical PredictorsFirth’s Correction for Monotone LikelihoodConditional Logistic Regression for m:n MatchingModel Using Time-Dependent Explanatory VariablesTime-Dependent Repeated Measurements of a CovariateSurvival CurvesAnalysis of ResidualsAnalysis of Recurrent Events DataAnalysis of Clustered DataModel Assessment Using Cumulative Sums of Martingale ResidualsBayesian Analysis of the Cox ModelBayesian Analysis of Piecewise Exponential ModelAnalysis of Competing-Risks Data
- References
BAYES <options> ;
The BAYES statement requests a Bayesian analysis of the regression model by using Gibbs sampling. The Bayesian posterior samples (also known as the chain) for the regression parameters can be output to a SAS data set. Table 71.4 summarizes the options available in the BAYES statement.
Table 71.4: BAYES Statement Options
|
Option |
Description |
|---|---|
|
Monte Carlo Options |
|
|
Specifies initial values of the chain |
|
|
Specifies the number of burn-in iterations |
|
|
Specifies the number of iterations after burn-in |
|
|
Specifies the sampling algorithm |
|
|
Specifies the random number generator seed |
|
|
Controls the thinning of the Markov chain |
|
|
Model and Prior Options |
|
|
Specifies the prior of the regression coefficients |
|
|
Specifies the prior of the dispersion parameter for frailties |
|
|
Specifies details of the piecewise exponential model |
|
|
Summaries and Diagnostics of the Posterior Samples |
|
|
Displays convergence diagnostics |
|
|
Displays diagnostic plots |
|
|
Displays summary statistics |
|
|
Posterior Samples |
|
|
Names a SAS data set for the posterior samples |
|
The following list describes these options and their suboptions.
-
COEFFPRIOR=UNIFORM | NORMAL <(normal-option)> | ZELLNER <(zellner-option)>
CPRIOR=UNIFORM | NORMAL <(normal-option)> | ZELLNER <(zellner-option)>
COEFF=UNIFORM | NORMAL <(normal-option)> | ZELLNER <(zellner-option)> -
specifies the prior distribution for the regression coefficients. The default is COEFFPRIOR=UNIFORM. The following prior distributions are available:
- UNIFORM
-
specifies a flat prior—that is, the prior that is proportional to a constant (
 for all
  ).
).
- NORMAL<(normal-option)>
-
specifies a normal distribution. The normal-options include the following:
- INPUT=SAS-data-set
-
specifies a SAS data set that contains the mean and covariance information of the normal prior. The data set must contain the
_TYPE_variable to identify the observation type, and it must contain a variable to represent each regression coefficient. If the data set also contains the_NAME_variable, values of this variable are used to identify the covariances for the_TYPE_=’COV’ observations; otherwise, the_TYPE_=’COV’ observations are assumed to be in the same order as the explanatory variables in the MODEL statement. PROC PHREG reads the mean vector from the observation with_TYPE_=’MEAN’ and the covariance matrix from observations with_TYPE_=’COV’. For an independent normal prior, the variances can be specified with_TYPE_=’VAR’; alternatively, the precisions (inverse of the variances) can be specified with_TYPE_=’PRECISION’. - RELVAR <=c>
-
specifies a normal prior
 , where
  is a diagonal matrix with diagonal elements equal to the variances of the corresponding ML estimator. By default, c=1E6.
- VAR=c
-
specifies the normal prior
 , where
  is the identity matrix.
If you do not specify a normal-option, the normal prior
 , where is the identity matrix, is used. See the section Normal Prior for details.
- ZELLNER<(zellner-option)>
-
specifies the Zellner g-prior for the regression coefficients. The g-prior is a normal prior distribution with mean zero and covariance matrix equal to
 , where
  is the design matrix and g can be a constant or a parameter with a gamma prior. The zellner-options include the following:
If you do not specify a zellner-option, the default is ZELLNER(g=1E–6).
-
DISPERSIONPRIOR=GAMMA<(gamma-options)> | IGAMMA<(igamma-options)> | IMPROPER
DPRIOR=GAMMA<(gamma-options)> | IGAMMA<(igamma-options)> | IMPROPER -
specifies the prior distribution of the dispersion parameter. For gamma frailty, the dispersion parameter is the variance of the gamma frailty; for lognormal frailty, the dispersion parameter is the variance of the normal random component. The default is DISPERSIONPRIOR=IMPROPER.
You can specify the following values for this option:
- GAMMA<(gamma-options)>
-
specifies the gamma prior. A gamma prior
 with hyperparameters a and b has density
  , where a is the shape parameter and b is the inverse-scale parameter. You can use the following gamma-options enclosed in parentheses to specify the hyperparameters:
The default is SHAPE=1E–4 and ISCALE=1E–4.
- IGAMMA<(igamma-options)>
-
specifies the inverse-gamma prior. An inverse-gamma prior
 with hyperparameters a and b has a density
  , where a is the shape parameter and b is the scale parameter. You can use the following igamma-options enclosed in parentheses to specify the hyperparameters:
The default is SHAPE=2.001 AND SCALE=0.01.
- IMPROPER
-
specifies the improper prior, which has a density
 proportional to
  .
.
-
DIAGNOSTICS=ALL | NONE | keyword | (keyword-list)
DIAG=ALL | NONE | keyword | (keyword-list) -
controls the number of diagnostics produced. You can request all the diagnostics in the following list by specifying DIAGNOSTICS=ALL. If you do not want any of these diagnostics, you specify DIAGNOSTICS=NONE. If you want some but not all of the diagnostics, or if you want to change certain settings of these diagnostics, you specify a subset of the following keywords. The default is DIAGNOSTICS=(AUTOCORR GEWEKE ESS).
- AUTOCORR <(LAGS= numeric-list)>
-
computes the autocorrelations of lags given by LAGS= list for each parameter. Elements in the list are truncated to integers and repeated values are removed. If the LAGS= option is not specified, autocorrections of lags 1, 5, 10, and 50 are computed for each variable. See the section Autocorrelations in Chapter 7: Introduction to Bayesian Analysis Procedures, for details.
- ESS
-
computes the effective sample size of Kass et al. (1998), the correlation time, and the efficiency of the chain for each parameter. See the section Effective Sample Size in Chapter 7: Introduction to Bayesian Analysis Procedures, for details.
-
MCSE
MCERROR -
computes the Monte Carlo standard error for each parameter. The Monte Caro standard error, which measures the simulation accuracy, is the standard error of the posterior mean estimate and is calculated as the posterior standard deviation divided by the square root of the effective sample size. See the section Standard Error of the Mean Estimate in Chapter 7: Introduction to Bayesian Analysis Procedures, for details.
- HEIDELBERGER <(heidel-options)>
-
computes the Heidelberger and Welch tests for each parameter. See the section Heidelberger and Welch Diagnostics in Chapter 7: Introduction to Bayesian Analysis Procedures, for details. The tests consist of a stationary test and a halfwidth test. The former tests the null hypothesis that the sample values form a stationary process. If the stationarity test is passed, a halfwidth test is then carried out. Optionally, you can specify one or more of the following heidel-options:
- SALPHA=value
-
specifies the
 level
level  for the stationarity test. The default is the value of the ALPHA= option in the PROC PHREG statement, or 0.05 if that option is not specified.
- HALPHA=value
-
specifies the
level for the halfwidth test. The default is the value of the ALPHA= option in the PROC PHREG statement, or 0.05 if that option is not specified.
- EPS=value
-
specifies a small positive number
 such that if the halfwidth is less than times the sample mean of the retaining samples, the halfwidth test is passed.
- GELMAN <(gelman-options)>
-
computes the Gelman and Rubin convergence diagnostics. See the section Gelman and Rubin Diagnostics in Chapter 7: Introduction to Bayesian Analysis Procedures, for details. You can specify one or more of the following gelman-options:
- GEWEKE <geweke-options>
-
computes the Geweke diagnostics. See the section Geweke Diagnostics in Chapter 7: Introduction to Bayesian Analysis Procedures, for details. The diagnostic is essentially a two-sample t-test between the first
 portion and the last
  portion of the chain. The default is =0.1 and =0.5, but you can choose other fractions by using the following geweke-options:
- RAFTERY <(raftery-options)>
-
computes the Raftery and Lewis diagnostics. See the section Raftery and Lewis Diagnostics in Chapter 7: Introduction to Bayesian Analysis Procedures, for details. The diagnostic evaluates the accuracy of the estimated quantile (
 for a given
  ) of a chain. can achieve any degree of accuracy when the chain is allowed to run for a long time. A stopping criterion is when the estimated
probability
) of a chain. can achieve any degree of accuracy when the chain is allowed to run for a long time. A stopping criterion is when the estimated
probability  reaches within
  of the value Q with probability S; that is,
  . The following raftery-options enable you to specify
  and a precision level for a stationary test.
- INITIAL=SAS-data-set
-
specifies the SAS data set that contains the initial values of the Markov chains. The INITIAL= data set must contain a variable for each parameter in the model. You can specify multiple rows as the initial values of the parallel chains for the Gelman-Rubin statistics, but posterior summary statistics, diagnostics, and plots are computed only for the first chain.
- NBI=number
-
specifies the number of burn-in iterations before the chains are saved. The default is 2000.
- NMC=number
-
specifies the number of iterations after the burn-in. The default is 10000.
-
OUTPOST=SAS-data-set
OUT=SAS-data-set -
names the SAS data set that contains the posterior samples. See the section OUTPOST= Output Data Set in the BAYES Statement for more information. Alternatively, you can output the posterior samples into a data set, as shown in the following example in which the data set is named
PostSamp.ODS OUTPUT PosteriorSample = PostSamp;
- PIECEWISE <=keyword <(<NINTERVAL=number> <INTERVALS=(numeric-list)> <PRIOR=option>)>>
-
specifies that the piecewise constant baseline hazard model be used in the Bayesian analysis. You can specify one of the following two keywords:
Specifying PIECEWISE by itself is the same as specifying PIECEWISE=LOGHAZARD.
You can choose one of the following two options to specify the partition of the time axis into intervals of constant baseline hazards:
-
NINTERVAL=number
N=number -
specifies the number of intervals with constant baseline hazard rates. PROC PHREG partitions the time axis into the given number of intervals with approximately equal number of events in each interval.
-
INTERVALS=(numeric-list)
INTERVAL=(numeric-list) -
specifies the list of numbers that partition the time axis into disjoint intervals with constant baseline hazard in each interval. For example, INTERVALS=(100, 150, 200, 250, 300) specifies a model with a constant hazard in the intervals [0,100), [100,150), [150,200), [200,250), [250,300), and [300,
 ). Each interval must contain at least one event; otherwise, the posterior distribution can be improper, and inferences cannot
be derived from an improper posterior distribution.
). Each interval must contain at least one event; otherwise, the posterior distribution can be improper, and inferences cannot
be derived from an improper posterior distribution.
If neither NINTERVAL= nor INTERVAL= is specified, the default is NINTERVAL=8.
To specify the prior for the baseline hazards (
 ) in the original scale, you specify the following:
- PRIOR = IMPROPER | UNIFORM | GAMMA<(gamma-option)> | ARGAMMA<(argamma-option)>
-
The default is PRIOR=IMPROPER. The available prior options include the following:
- IMPROPER
-
specifies the noninformative and improper prior
 for all
  .
.
- UNIFORM
-
specifies a uniform prior on the real line; that is,
 for all
  .
.
- GAMMA <(gamma-option)>
-
specifies an independent gamma prior
with density  , which can be followed by one of the following gamma-options enclosed in parentheses. The hyperparameters a and b are the shape and inverse-scale parameters of the gamma distribution, respectively. See the section Independent Gamma Prior for details. The default is
  for each
  , setting the prior mean to 1 with variance 1E4. This prior is proper and reasonably noninformative.
- INPUT=SAS-data-set
-
specifies a data set containing the hyperparameters of the independent gamma prior. The data set must contain the
_TYPE_variable to identify the observation type, and it must contain the variables namedLambda1,Lambda2, …, and so forth, to represent the hazard parameters. The observation with_TYPE_=’SHAPE’ identifies the shape parameters, and the observation with_TYPE_=’ISCALE’ identifies the inverse-scale parameters. - RELSHAPE<=c>
-
specifies independent
 distribution, where
  ’s are the MLEs of the hazard rates. This prior has mean and variance
  . By default, c=1E–4.
- SHAPE=a and ISCALE=b
-
together specify the
 prior.
-
SHAPE=c
ISCALE=c -
specifies the
 prior.
- ARGAMMA <(argamma-option)>
-
specifies an autoregressive gamma prior of order 1, which can be followed by one of the following argamma-options. See the section AR1 Prior for details.
- INPUT=SAS-data-set
-
specifies a data set containing the hyperparameters of the correlated gamma prior. The data set must contain the
_TYPE_variable to identify the observation type, and it must contain the variables namedLambda1,Lambda2, …, and so forth, to represent the hazard parameters. The observation with_TYPE_=’SHAPE’ identifies the shape parameters, and the observation with_TYPE_=’ISCALE’ identifies the relative inverse-scale parameters; that is, if and
and  are, respectively, the SHAPE and ISCALE values for
  , then
  , and
, and  for
for  .
.
- SHAPE=a and SCALE=b
-
together specify that
 and
and 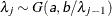 for
for  .
.
-
SHAPE=c
ISCALE=c -
specifies that
 and
and  for .
for .
-
NINTERVAL=number
To specify the prior for ![]() , the hazard parameters in the log scale, you specifying the following:
, the hazard parameters in the log scale, you specifying the following:
- PRIOR=UNIFORM | NORMAL<(normal-option)>
-
specifies the prior for the loghazard parameters. The default is PRIOR=UNIFORM. The available PRIOR= options are as follows:
- UNIFORM
-
specifies the uniform prior on the real line; that is,
 for all
  .
.
- NORMAL<(normal-option)>
-
specifies a normal prior distribution on the log-hazard parameters. The normal-options include the following. If you do not specify a normal-option, the normal prior
, where is the identity matrix, is used.
- INPUT=SAS-data-set
-
specifies a SAS data set containing the mean and covariance information of the normal prior. The data set must contain the _TYPE_ variable to identify the observation type, and it must contain variables named
Alpha1,Alpha2, …, and so forth, to represent the log-hazard parameters. If the data set also contains the_NAME_variable, the value of this variable will be used to identify the covariances for the_TYPE_=’COV’ observations; otherwise, the_TYPE_=’COV’ observations are assumed to be in the same order as the explanatory variables in the MODEL statement. PROC PHREG reads the mean vector from the observation with_TYPE_=’MEAN’ and the covariance matrix from observations with_TYPE_=’COV’. See the section Normal Prior for details. For an independent normal prior, the variances can be specified with_TYPE_=’VAR’; alternatively, the precisions (inverse of the variances) can be specified with_TYPE_=’PRECISION’.If you have a joint normal prior for the log-hazard parameters and the regression coefficients, specify the same data set containing the mean and covariance information of the multivariate normal distribution in both the COEFFPRIOR=NORMAL(INPUT=) and the PIECEWISE=LOGHAZARD(PRIOR=NORMAL(INPUT=)) options. See the section Joint Multivariate Normal Prior for Log-Hazards and Regression Coefficients for details.
- RELVAR <=c>
-
specifies the normal prior
 , where is a diagonal matrix with diagonal elements equal to the variances of the corresponding ML estimator. By default, c=1E6.
- VAR=c
-
specifies the normal prior
 , where is the identity matrix.
-
PLOTS <(global-plot-options)> = plot-request
PLOTS <(global-plot-options)> = (plot-requests) -
controls the diagnostic plots produced through ODS Graphics. Three types of plots can be requested: trace plots, autocorrelation function plots, and kernel density plots. By default, the plots are displayed in panels unless the global plot option UNPACK is specified. If you specify more than one type of plots, the plots are displayed by parameters unless the global plot option GROUPBY=TYPE is specified. When you specify only one plot request, you can omit the parentheses around the plot request. For example:
 plots=none
 plots(unpack)=trace
 plots=(trace autocorr)
ODS Graphics must be enabled before plots can be requested. For example:
ods graphics on;
proc phreg;
   model y=x;
   bayes plots=trace;
run;
If ODS Graphics is enabled but you do not specify the PLOTS= option in the BAYES statement, then PROC PHREG produces, for each parameter, a panel that contains the trace plot, the autocorrelation function plot, and the density plot. This is equivalent to specifying
plots=(trace autocorr density).The global-plot-options include the following:
The plot-requests include the following:
Consider a model with four parameters, X1–X4. Displays for various specification are depicted as follows.
-
PLOTS=(TRACE AUTOCORR) displays the trace and autocorrelation plots for each parameter side by side with two parameters per panel:
Display 1
Trace(X1)
Autocorr(X1)
Trace(X2)
Autocorr(X2)
Display 2
Trace(X3)
Autocorr(X3)
Trace(X4)
Autocorr(X4)
-
PLOTS(GROUPBY=TYPE)=(TRACE AUTOCORR) displays all the paneled trace plots, followed by panels of autocorrelation plots:
Display 1
Trace(X1)
Trace(X2)
Display 2
Trace(X3)
Trace(X4)
Display 3
Autocorr(X1)
Autocorr(X2)
Autocorr(X3)
Autocorr(X4)
-
PLOTS(UNPACK)=(TRACE AUTOCORR) displays a separate trace plot and a separate correlation plot, parameter by parameter:
Display 1
Trace(X1)
Display 2
Autocorr(X1)
Display 3
Trace(X2)
Display 4
Autocorr(X2)
Display 5
Trace(X3)
Display 6
Autocorr(X3)
Display 7
Trace(X4)
Display 8
Autocorr(X4)
-
PLOTS(UNPACK GROUPBY=TYPE) = (TRACE AUTOCORR) displays all the separate trace plots followed by the separate autocorrelation plots:
Display 1
Trace(X1)
Display 2
Trace(X2)
Display 3
Trace(X3)
Display 4
Trace(X4)
Display 5
Autocorr(X1)
Display 6
Autocorr(X2)
Display 7
Autocorr(X3)
Display 8
Autocorr(X4)
-
- SAMPLING=keyword
-
specifies the sampling algorithm used in the Markov chain Monte Carlo (MCMC) simulations. Two sampling algorithms are available:
For details about the MCMC sampling algorithms, see the section Markov Chain Monte Carlo Method in Chapter 7: Introduction to Bayesian Analysis Procedures.
- SEED=number
-
specifies an integer seed ranging from 1 to
 –1 for the random number generator in the simulation. Specifying a seed enables you to reproduce identical Markov chains for
the same specification. If the SEED= option is not specified, or if you specify a nonpositive seed, a random seed is derived
from the time of day.
–1 for the random number generator in the simulation. Specifying a seed enables you to reproduce identical Markov chains for
the same specification. If the SEED= option is not specified, or if you specify a nonpositive seed, a random seed is derived
from the time of day.
-
STATISTICS <(global-options)> = ALL | NONE | keyword | (keyword-list)
STATS <(global-statoptions)> = ALL | NONE | keyword | (keyword-list) -
controls the number of posterior statistics produced. Specifying STATISTICS=ALL is equivalent to specifying STATISTICS=(SUMMARY INTERVAL COV CORR). If you do not want any posterior statistics, you specify STATISTICS=NONE. The default is STATISTICS=(SUMMARY INTERVAL). See the section Summary Statistics in Chapter 7: Introduction to Bayesian Analysis Procedures, for details. The global-options include the following:
You can specify the following values for a keyword or as part of a keyword-list. To specify a list, place parentheses around multiple keywords that are separated by spaces.
-
THINNING=number
THIN=number -
controls the thinning of the Markov chain. Only one in every k samples is used when THINNING=k, and if NBI=
 and NMC=n, the number of samples kept is
![\[ \biggl [ \frac{n_0+n}{k} \biggr ] - \biggl [ \frac{n_0}{k} \biggr ] \]](images/statug_phreg0102.png)
where [a] represents the integer part of the number a. The default is THINNING=1.