The STDRATE Procedure
- Overview
- Getting Started
-
Syntax

-
DetailsRateRiskDirect StandardizationMantel-Haenszel Effect EstimationIndirect Standardization and Standardized Morbidity/Mortality RatioAttributable Fraction and Population Attributable FractionApplicable Data Sets and Required Variables for Method SpecificationsApplicable Confidence Limits for Rate and Risk StatisticsTable OutputODS Table NamesGraphics OutputODS Graphics
-
Examples
- References
Getting Started: STDRATE Procedure
This example illustrates indirect standardization and uses the standardized mortality ratio to compare the death rate from skin cancer between people who live in the state of Florida and people who live in the United States as a whole.
The Florida_C43 data set contains the stratum-specific mortality information for skin cancer in year 2000 for the state of Florida (Florida
Department of Health, 2000, 2012). The variable Age is a grouping variable that forms the strata in the standardization, and the variables Event and PYear identify the number of events and total person-years, respectively. The COMMA11. format is specified in the DATA step to
input numerical values that contain commas in PYear.
data Florida_C43;
   input Age $1-5 Event PYear comma11.;
   datalines;
00-04    0    953,785
05-14    0  1,997,935
15-24    4  1,885,014
25-34   14  1,957,573
35-44   43  2,356,649
45-54   72  2,088,000
55-64   70  1,548,371
65-74  126  1,447,432
75-84  136  1,087,524
85+     73    335,944
;
The US_C43 data set contains the corresponding stratum-specific mortality information for the United States in year 2000 (Miniño et al.,
2002; U.S. Bureau of Census, 2011). The variable Age is the grouping variable, and the variables Event and PYear identify the number of events and the total person-years, respectively.
data US_C43;
   input Age $1-5 Event comma7. PYear comma12.;
   datalines;
00-04      0  19,175,798
05-14      1  41,077,577
15-24     41  39,183,891
25-34    186  39,892,024
35-44    626  45,148,527
45-54  1,199  37,677,952
55-64  1,303  24,274,684
65-74  1,637  18,390,986
75-84  1,624  12,361,180
85+      803   4,239,587
;
The following statements invoke the STDRATE procedure and request indirect standardization to compare death rates between the state of Florida and the United States:
ods graphics on;
proc stdrate data=Florida_C43 refdata=US_C43
             method=indirect
             stat=rate(mult=100000)
             plots=all
             ;
   population event=Event total=PYear;
   reference  event=Event total=PYear;
   strata Age / stats smr;
run;
ods graphics off;
The DATA= and REFDATA= options name the study data set and reference data set, respectively. The METHOD=INDIRECT option requests indirect standardization. The STAT=RATE option specifies the rate as the frequency measure for standardization, and the MULT=100000 suboption (which is the default) displays the rates per 100,000 person-years in the table output and graphics output. The PLOTS=ALL option requests all appropriate plots with indirect standardization.
The POPULATION statement specifies the options that are related to the study population, and the EVENT= and TOTAL= options specify variables for the number of events and person-years in the study population, respectively.
The REFERENCE statement specifies the options related to the reference population, and the EVENT= and TOTAL= options specify variables for the number of events and person-years in the reference population, respectively.
The STRATA statement lists the variable Age that forms the strata. The STATS option requests a strata information table that contains stratum-specific statistics such
as rates, and the SMR option requests a table of stratum-specific SMR estimates.
The “Standardization Information” table in Figure 88.1 displays the standardization information.
Figure 88.1: Standardization Information
| Standardization Information | |
|---|---|
| Data Set | WORK.FLORIDA_C43 |
| Reference Data Set | WORK.US_C43 |
| Method | Indirect Standardization |
| Statistic | Rate |
| Number of Strata | 10 |
| Rate Multiplier | 100000 |
The STATS option in the STRATA statement requests that the “Indirectly Standardized Strata Statistics” table in Figure 88.2 display the strata information and expected number of events at each stratum. The MULT=100000 suboption in the STAT=RATE
option requests that crude rates per ![]() person-years be displayed. The Expected Events column displays the expected number of events when the stratum-specific rates
in the reference data set are applied to the corresponding person-years in the study data set.
person-years be displayed. The Expected Events column displays the expected number of events when the stratum-specific rates
in the reference data set are applied to the corresponding person-years in the study data set.
Figure 88.2: Strata Information (Indirect Standardization)
| Indirectly Standardized Strata Statistics Rate Multiplier = 100000 |
||||||||||||
|---|---|---|---|---|---|---|---|---|---|---|---|---|
| Stratum Index |
Age | Study Population | Reference Population | Expected Events |
||||||||
| Observed Events |
Population-Time | Crude Rate | Standard Error |
Population-Time | Crude Rate |
|||||||
| Value | Proportion | 95% Normal Confidence Limits |
Value | Proportion | ||||||||
| 1 | 00-04 | 0 | 953785 | 0.0609 | 0.0000 | 0.00000 | 0.0000 | 0.0000 | 19175798 | 0.0681 | 0.0000 | 0.000 |
| 2 | 05-14 | 0 | 1997935 | 0.1276 | 0.0000 | 0.00000 | 0.0000 | 0.0000 | 41077577 | 0.1460 | 0.0024 | 0.049 |
| 3 | 15-24 | 4 | 1885014 | 0.1204 | 0.2122 | 0.10610 | 0.0042 | 0.4202 | 39183891 | 0.1392 | 0.1046 | 1.972 |
| 4 | 25-34 | 14 | 1957573 | 0.1250 | 0.7152 | 0.19114 | 0.3405 | 1.0898 | 39892024 | 0.1418 | 0.4663 | 9.127 |
| 5 | 35-44 | 43 | 2356649 | 0.1505 | 1.8246 | 0.27825 | 1.2793 | 2.3700 | 45148527 | 0.1604 | 1.3865 | 32.676 |
| 6 | 45-54 | 72 | 2088000 | 0.1333 | 3.4483 | 0.40638 | 2.6518 | 4.2448 | 37677952 | 0.1339 | 3.1822 | 66.445 |
| 7 | 55-64 | 70 | 1548371 | 0.0989 | 4.5209 | 0.54035 | 3.4618 | 5.5799 | 24274684 | 0.0863 | 5.3677 | 83.112 |
| 8 | 65-74 | 126 | 1447432 | 0.0924 | 8.7051 | 0.77551 | 7.1851 | 10.2250 | 18390986 | 0.0654 | 8.9011 | 128.837 |
| 9 | 75-84 | 136 | 1087524 | 0.0695 | 12.5055 | 1.07234 | 10.4037 | 14.6072 | 12361180 | 0.0439 | 13.1379 | 142.878 |
| 10 | 85+ | 73 | 335944 | 0.0215 | 21.7298 | 2.54328 | 16.7451 | 26.7146 | 4239587 | 0.0151 | 18.9405 | 63.630 |
With ODS Graphics enabled, the PLOTS=ALL option displays all appropriate plots. With indirect standardization and a rate statistic, these plots include the strata distribution plot, the strata rate plot, and the strata SMR plot. By default, strata levels are displayed on the vertical axis for these plots.
The strata distribution plot displays proportions for stratum-specific person-years in the study and reference populations, as shown in Figure 88.3.
Figure 88.3: Strata Distribution Plot
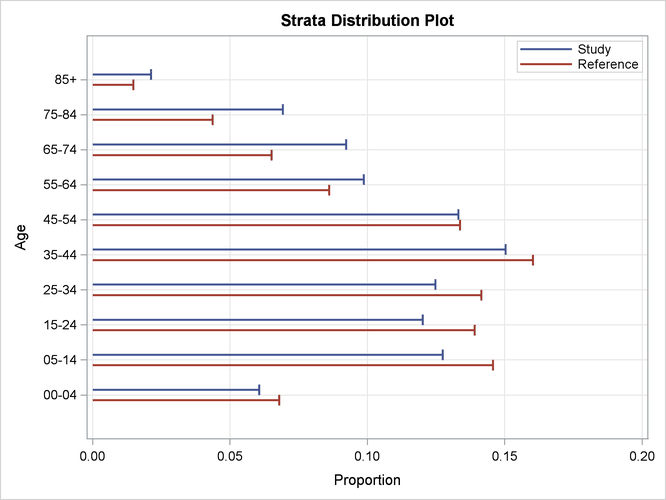
The strata distribution plot displays the proportions in the “Indirectly Standardized Strata Statistics” table in Figure 88.2. In the plot, the proportions of the study population are identified by the blue lines, and the proportions of the reference population are identified by the red lines. The plot shows that the study population has higher proportions in older age groups and lower proportions in younger age groups than the reference population.
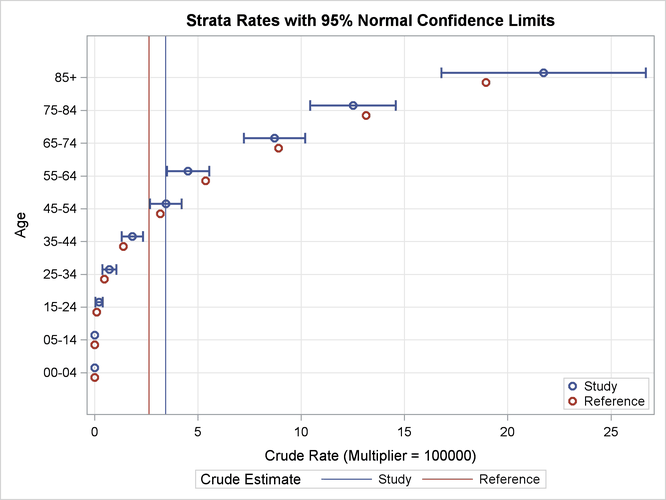
The strata rate plot displays stratum-specific rate estimates in the study and reference populations, as shown in Figure 88.4. This plot displays the rate estimates in the “Indirectly Standardized Strata Statistics” table in Figure 88.2. In addition, the plot displays the confidence limits for the rate estimates in the study population and the overall crude rates for the two populations.
Figure 88.4: Strata Rate Plot
The SMR option in the STRATA statement requests that the “Strata SMR Estimates” table in Figure 88.5 display the strata SMR at each stratum. The MULT=100000 suboption in the STAT=RATE option requests that the reference rates
per ![]() person-years be displayed.
person-years be displayed.
Figure 88.5: Strata SMR Information
| Strata SMR Estimates Rate Multiplier = 100000 |
|||||||||
|---|---|---|---|---|---|---|---|---|---|
| Stratum Index |
Age | Study Population | Reference Crude Rate |
Expected Events |
SMR | Standard Error |
|||
| Observed Events |
Population- Time |
95% Normal Confidence Limits |
|||||||
| 1 | 00-04 | 0 | 953785 | 0.0000 | 0.000 | . | . | . | . |
| 2 | 05-14 | 0 | 1997935 | 0.0024 | 0.049 | 0.0000 | . | . | . |
| 3 | 15-24 | 4 | 1885014 | 0.1046 | 1.972 | 2.0280 | 1.0140 | 0.0406 | 4.0154 |
| 4 | 25-34 | 14 | 1957573 | 0.4663 | 9.127 | 1.5339 | 0.4099 | 0.7304 | 2.3373 |
| 5 | 35-44 | 43 | 2356649 | 1.3865 | 32.676 | 1.3160 | 0.2007 | 0.9226 | 1.7093 |
| 6 | 45-54 | 72 | 2088000 | 3.1822 | 66.445 | 1.0836 | 0.1277 | 0.8333 | 1.3339 |
| 7 | 55-64 | 70 | 1548371 | 5.3677 | 83.112 | 0.8422 | 0.1007 | 0.6449 | 1.0395 |
| 8 | 65-74 | 126 | 1447432 | 8.9011 | 128.837 | 0.9780 | 0.0871 | 0.8072 | 1.1487 |
| 9 | 75-84 | 136 | 1087524 | 13.1379 | 142.878 | 0.9519 | 0.0816 | 0.7919 | 1.1118 |
| 10 | 85+ | 73 | 335944 | 18.9405 | 63.630 | 1.1473 | 0.1343 | 0.8841 | 1.4104 |
The “Strata SMR Estimates” table shows that although SMR is less than 1 only at three age strata (55–64, 65–74, and 75–84), these three strata contain
about ![]() of the total events.
of the total events.
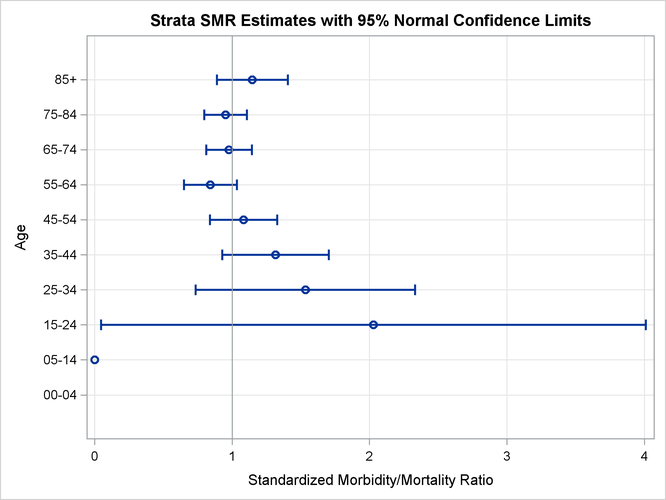
The strata SMR plot displays stratum-specific SMR estimates with confidence limits, as shown in Figure 88.6. The plot displays the SMR estimates in the “Strata SMR Estimates” table in Figure 88.5.
Figure 88.6: Strata SMR Plot
The METHOD=INDIRECT option requests that the “Standardized Morbidity/Mortality Ratio” table in Figure 88.7 be displayed. The table displays the SMR, its confidence limits, and the test for the null hypothesis ![]() . The default ALPHA=0.05 option requests that
. The default ALPHA=0.05 option requests that ![]() confidence limits be constructed.
confidence limits be constructed.
Figure 88.7: Standardized Morbidity/Mortality Ratio
| Standardized Morbidity/Mortality Ratio | |||||||
|---|---|---|---|---|---|---|---|
| Observed Events |
Expected Events |
SMR | Standard Error |
95% Normal Confidence Limits |
Z | Pr > |Z| | |
| 538 | 528.726 | 1.0175 | 0.0439 | 0.9316 | 1.1035 | 0.40 | 0.6893 |
The ![]() normal confidence limits contain the null hypothesis value
normal confidence limits contain the null hypothesis value ![]() , and the hypothesis of
, and the hypothesis of ![]() is not rejected at the
is not rejected at the ![]() level from the normal test.
level from the normal test.
The “Indirectly Standardized Rate Estimates” table in Figure 88.8 displays the indirectly standardized rate and related statistics.
Figure 88.8: Standardized Rate Estimates (Indirect Standardization)
| Indirectly Standardized Rate Estimates Rate Multiplier = 100000 |
|||||||||
|---|---|---|---|---|---|---|---|---|---|
| Study Population | Reference Crude Rate |
Expected Events |
SMR | Standardized Rate | |||||
| Observed Events |
Population- Time |
Crude Rate |
Estimate | Standard Error |
95% Normal Confidence Limits |
||||
| 538 | 15658227 | 3.4359 | 2.6366 | 528.726 | 1.0175 | 2.6829 | 0.1157 | 2.4562 | 2.9096 |
The indirectly standardized rate estimate is the product of the SMR and the crude rate estimate for the reference population.
The table shows that although the crude rate in the state of Florida (3.4359) is ![]() higher than the crude rate in the U.S. (2.6366), the resulting standardized rate (2.6829) is close to the crude rate in the
U.S.
higher than the crude rate in the U.S. (2.6366), the resulting standardized rate (2.6829) is close to the crude rate in the
U.S.