The STDRATE Procedure
- Overview
- Getting Started
-
Syntax

-
DetailsRateRiskDirect StandardizationMantel-Haenszel Effect EstimationIndirect Standardization and Standardized Morbidity/Mortality RatioAttributable Fraction and Population Attributable FractionApplicable Data Sets and Required Variables for Method SpecificationsApplicable Confidence Limits for Rate and Risk StatisticsTable OutputODS Table NamesGraphics OutputODS Graphics
-
Examples
- References
Example 88.2 Computing Mantel-Haenszel Risk Estimation
This example uses Mantel-Haenszel method to estimate the effect of household smoking on respiratory symptoms of school children, after adjusting for the effects of the student’s grade and household pets.
Suppose that the School data set contains the stratum-specific numbers of cases of respiratory symptoms in a given school year for a school district.
Variables Pet and Grade are the grouping variables that form the strata in the standardization, and the variable Smoking identifies students who have smokers in their households. The variables Case and Student indicate the number of cases with respiratory symptoms and the total number of students, respectively.
data School;
   input Smoking $ Pet $ Grade $ Case Student;
   datalines;
Yes   Yes   K-1   109    807
Yes   Yes   2-3   106    791
Yes   Yes   4-5   112    868
Yes   No    K-1   168   1329
Yes   No    2-3   162   1337
Yes   No    4-5   183   1594
No    Yes   K-1   284   2403
No    Yes   2-3   266   2237
No    Yes   4-5   273   2279
No    No    K-1   414   3398
No    No    2-3   372   3251
No    No    4-5   382   3270
;
The following statements invoke the STDRATE procedure and compute the Mantel-Haenszel rate difference statistic between students with household smokers and students without household smokers:
ods graphics on;
proc stdrate data=School
             method=mh
             stat=risk
             effect=diff
             plots=all
             ;
   population group=Smoking event=Case total=Student;
   strata Pet Grade / order=data stats(cl=none) effect;
run;
ods graphics off;
The ORDER=DATA option in the STRATA statement sorts the strata by the order of appearance in the input data set.
The “Standardization Information” table in Output 88.2.1 displays the standardization information.
Output 88.2.1: Standardization Information
| Standardization Information | |
|---|---|
| Data Set | WORK.SCHOOL |
| Group Variable | Smoking |
| Method | Mantel-Haenszel |
| Statistic | Risk |
| Number of Strata | 6 |
The STATS option in the STRATA statement requests that the STDRATE procedure display a “Mantel-Haenszel Standardized Strata Statistics” table for study populations, as shown in Output 88.2.2. The table displays the strata information and the expected number of events in each stratum. The Expected Events column shows the expected number of events when the Mantel-Haenszel weights are applied to the corresponding stratum-specific risks in the study populations. The CL=NONE suboption requests that confidence limits for strata risks not be displayed.
Output 88.2.2: Mantel-Haenszel Standardized Strata Statistics
| Mantel-Haenszel Standardized Strata Statistics | |||||||||
|---|---|---|---|---|---|---|---|---|---|
| Smoking | Stratum Index |
Pet | Grade | Study Population | |||||
| Observed Events |
Number of Observations | Crude Risk | Mantel-Haenszel | ||||||
| Value | Proportion | Weight | Expected Events |
||||||
| No | 1 | Yes | K-1 | 284 | 2403 | 0.1427 | 0.118186 | 604.12 | 71.398 |
| No | 2 | Yes | 2-3 | 266 | 2237 | 0.1329 | 0.118909 | 584.37 | 69.487 |
| No | 3 | Yes | 4-5 | 273 | 2279 | 0.1353 | 0.119789 | 628.59 | 75.298 |
| No | 4 | No | K-1 | 414 | 3398 | 0.2018 | 0.121836 | 955.35 | 116.396 |
| No | 5 | No | 2-3 | 372 | 3251 | 0.1931 | 0.114426 | 947.38 | 108.405 |
| No | 6 | No | 4-5 | 382 | 3270 | 0.1942 | 0.116820 | 1071.62 | 125.187 |
| Yes | 1 | Yes | K-1 | 109 | 807 | 0.1200 | 0.135068 | 604.12 | 81.597 |
| Yes | 2 | Yes | 2-3 | 106 | 791 | 0.1176 | 0.134008 | 584.37 | 78.310 |
| Yes | 3 | Yes | 4-5 | 112 | 868 | 0.1291 | 0.129032 | 628.59 | 81.108 |
| Yes | 4 | No | K-1 | 168 | 1329 | 0.1976 | 0.126411 | 955.35 | 120.767 |
| Yes | 5 | No | 2-3 | 162 | 1337 | 0.1988 | 0.121167 | 947.38 | 114.791 |
| Yes | 6 | No | 4-5 | 183 | 1594 | 0.2370 | 0.114806 | 1071.62 | 123.028 |
With ODS Graphics enabled, the PLOTS=ALL option displays all appropriate plots. With the METHOD=MH and STAT=RISK options, these plots include the strata distribution plot, strata risk plot, and strata effect plot.
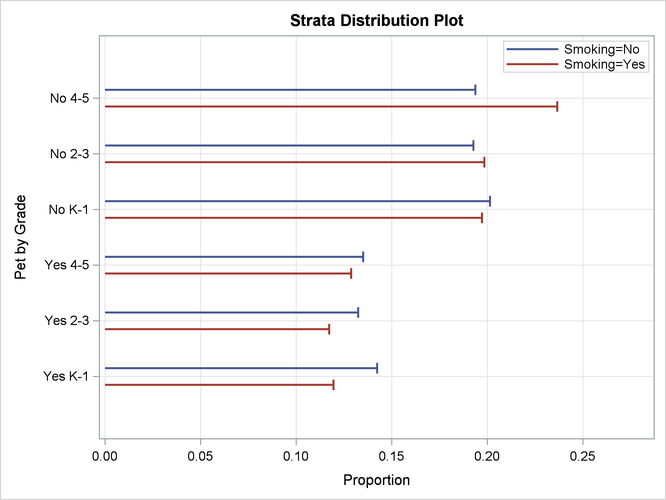
The strata distribution plot displays proportions for stratum-specific numbers of students in the study populations, as shown in Output 88.2.3.
Output 88.2.3: Strata Distribution Plot
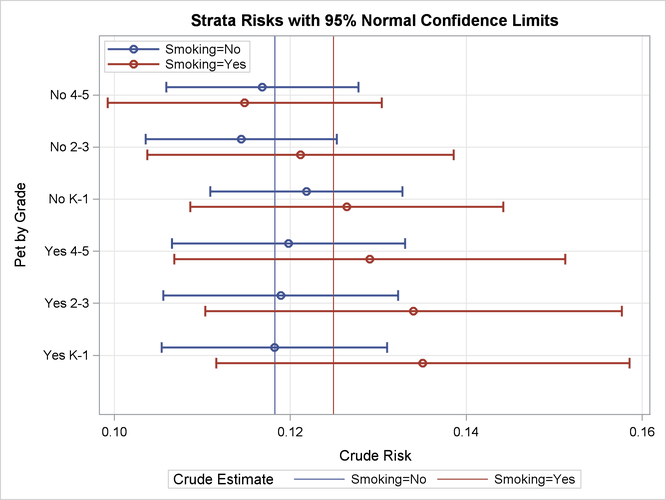
The strata risk plot displays stratum-specific risk estimates with confidence limits in the study populations, as shown in Output 88.2.4. This plot displays stratum-specific risk estimates in the “Mantel-Haenszel Standardized Strata Statistics” table in Output 88.2.2. In addition, the overall crude risks for the two study populations are also displayed. By default, strata levels are displayed on the vertical axis.
Output 88.2.4: Strata Risk Plot
The EFFECT option in the STRATA statement requests that the “Strata Risk Effect Estimates” table be displayed, as shown in Output 88.2.5. The EFFECT=DIFF option in the PROC STDRATE statement requests that strata risk differences be displayed.
Output 88.2.5: Strata Effect Estimates
| Strata Risk Effect Estimates | ||||||||
|---|---|---|---|---|---|---|---|---|
| Stratum Index |
Pet | Grade | Smoking | Risk Difference |
Standard Error |
|||
| No | Yes | 95% Normal Confidence Limits |
||||||
| 1 | Yes | K-1 | 0.11819 | 0.13507 | -.016883 | 0.013716 | -.043766 | 0.010001 |
| 2 | Yes | 2-3 | 0.11891 | 0.13401 | -.015098 | 0.013912 | -.042366 | 0.012169 |
| 3 | Yes | 4-5 | 0.11979 | 0.12903 | -.009243 | 0.013257 | -.035225 | 0.016740 |
| 4 | No | K-1 | 0.12184 | 0.12641 | -.004574 | 0.010704 | -.025554 | 0.016405 |
| 5 | No | 2-3 | 0.11443 | 0.12117 | -.006740 | 0.010527 | -.027373 | 0.013892 |
| 6 | No | 4-5 | 0.11682 | 0.11481 | 0.002014 | 0.009762 | -.017120 | 0.021148 |
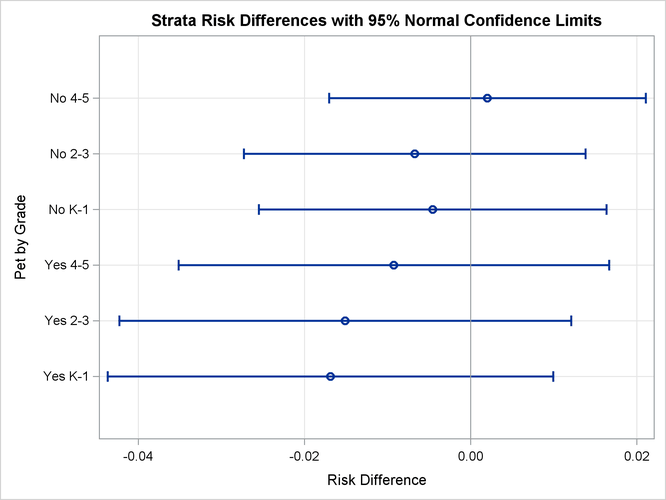
The “Strata Risk Effect Estimates” table shows that for the stratum of students without household pets in Grade 4–5, the risk is higher for students without household smokers than for students with household smokers. For all other strata, the risk is lower for students without household smokers than for students with household smokers. The difference is not significant in each stratum because the null value 0 is between the lower and upper confidence limits.
With ODS Graphics enabled, the PLOTS=EFFECT option displays the plot with the stratum-specific risk effect measures and their
associated confidence limits, as shown in Output 88.2.6. The EFFECT=DIFF option requests that the risk difference be displayed. By default, confidence limits are generated with
![]() confidence level. This plot displays the stratum-specific risk differences in the “Strata Risk Effect Estimates” table in Output 88.2.5.
confidence level. This plot displays the stratum-specific risk differences in the “Strata Risk Effect Estimates” table in Output 88.2.5.
Output 88.2.6: Strata Risk Plot
The “Mantel-Haenszel Standardized Risk Estimates” table in Output 88.2.7 displays the Mantel-Haenszel standardized risks and related statistics.
Output 88.2.7: Standardized Risk Estimates (Mantel-Haenszel Estimation)
| Mantel-Haenszel Standardized Risk Estimates | |||||||||
|---|---|---|---|---|---|---|---|---|---|
| Smoking | Study Population | Mantel-Haenszel | Standardized Risk | ||||||
| Observed Events |
Number of Observations |
Crude Risk |
Expected Events |
Weight | Estimate | Standard Error |
95% Normal Confidence Limits |
||
| No | 1991 | 16838 | 0.1182 | 566.172 | 4791.43 | 0.1182 | 0.00250 | 0.1133 | 0.1231 |
| Yes | 840 | 6726 | 0.1249 | 599.602 | 4791.43 | 0.1251 | 0.00404 | 0.1172 | 0.1331 |
The EFFECT=DIFF option requests that the “Risk Effect Estimates” table display the risk difference statistic for the two directly standardized risks, as shown in Output 88.2.8.
Output 88.2.8: Mantel-Haenszel Effect Estimates
| Risk Effect Estimates | |||||
|---|---|---|---|---|---|
| Smoking | Risk Difference |
Standard Error |
Z | Pr > |Z| | |
| No | Yes | ||||
| 0.1182 | 0.1251 | -0.00698 | 0.00475 | -1.47 | 0.1418 |
The table shows that although the standardized risk for students without household smokes is lower than the standardized risk
for students with household smokes, the difference (–0.00698) is not significant at the ![]() significance level, (p-value 0.1418).
significance level, (p-value 0.1418).