The POWER Procedure
- Overview
-
Getting Started

-
Syntax
PROC POWER Statement LOGISTIC Statement MULTREG Statement ONECORR Statement ONESAMPLEFREQ Statement ONESAMPLEMEANS Statement ONEWAYANOVA Statement PAIREDFREQ Statement PAIREDMEANS Statement PLOT Statement TWOSAMPLEFREQ Statement TWOSAMPLEMEANS Statement TWOSAMPLESURVIVAL Statement TWOSAMPLEWILCOXON Statement
-
Details
Overview of Power Concepts Summary of Analyses Specifying Value Lists in Analysis Statements Sample Size Adjustment Options Error and Information Output Displayed Output ODS Table Names Computational Resources Computational Methods and Formulas ODS Graphics ODS Styles Suitable for Use with PROC POWER
-
Examples
One-Way ANOVA The Sawtooth Power Function in Proportion Analyses Simple AB/BA Crossover Designs Noninferiority Test with Lognormal Data Multiple Regression and Correlation Comparing Two Survival Curves Confidence Interval Precision Customizing Plots Binary Logistic Regression with Independent Predictors Wilcoxon-Mann-Whitney Test
- References
Adding Reference Lines
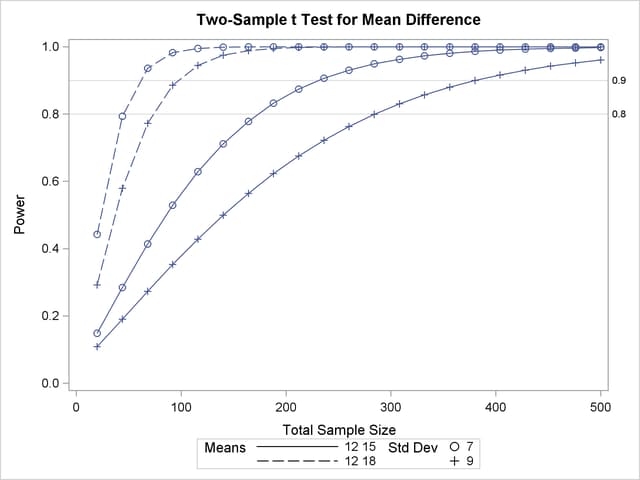
Suppose you want to add reference lines to highlight power=0.8 and power=0.9 on the plot in Output 70.8.5. You can add simple reference lines by using the YOPTS= option and REF= suboption in the PLOT statement to produce Output 70.8.11, with the following statements:
proc power plotonly;
   twosamplemeans test=diff
      groupmeans   = 12 | 15 18
      stddev       = 7 9
      power        = .
      ntotal       = 100;
   plot x=n min=20 max=500
      yopts=(ref=0.8 0.9);
run;
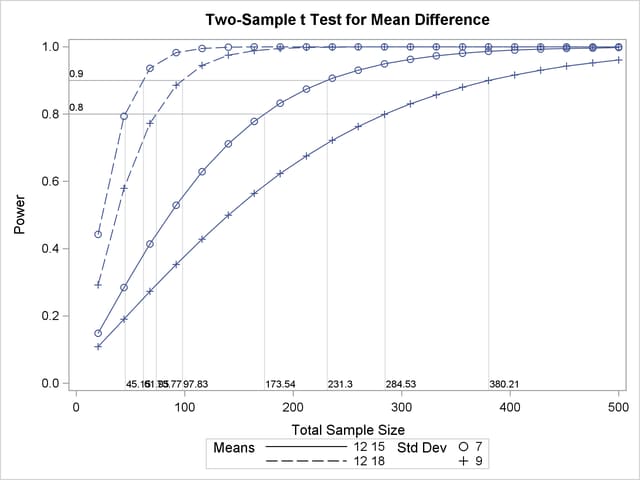
Or you can specify CROSSREF=YES to add reference lines that intersect each curve and cross over to the other axis:
   plot x=n min=20 max=500
      yopts=(ref=0.8 0.9 crossref=yes);
The resulting plot is shown in Output 70.8.12.
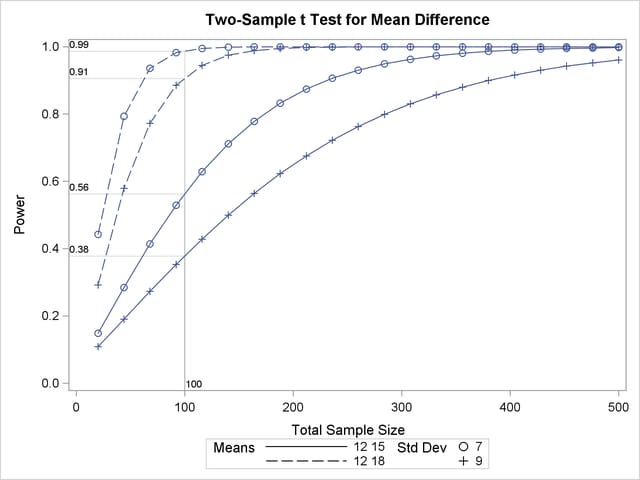
You can also add reference lines for the X axis by using the XOPTS= option instead of the YOPTS= option. For example, the following PLOT statement produces Output 70.8.13, which has crossing reference lines highlighting the sample size of 100:
   plot x=n min=20 max=500
      xopts=(ref=100 crossref=yes);
Note that the values that label the reference lines at the X axis in Output 70.8.12 and at the Y axis in Output 70.8.13 are linearly interpolated from two neighboring points on the curves. Thus they might not exactly match corresponding values that are computed directly from the methods in the section Computational Methods and Formulas—that is, computed by PROC POWER in the absence of a PLOT statement. The two ways of computing these values generally differ by a negligible amount.