| Statistical Graphics Using ODS |
| Graph Styles |
ODS styles control the overall appearance of graphs and tables. They specify colors, fonts, line styles, and other attributes of graph elements. The following styles are recommended for statistical work:
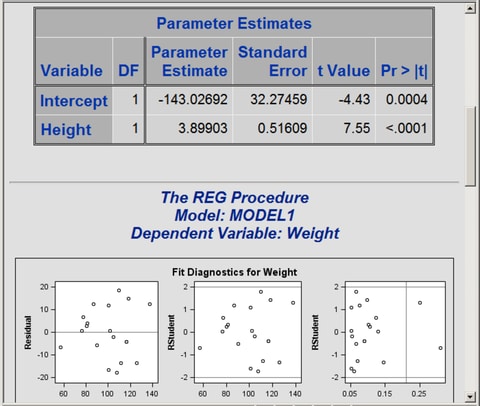
The DEFAULT style is a color style intended for general-purpose work. See Figure 21.13 for an example of the DEFAULT style, which is the default style for the HTML destination. Most other styles inherit some of their elements from this style.
The STATISTICAL style is a color style recommended for output in Web pages or color print media. The STATISTICAL style might not necessarily print well on black-and-white devices. See Figure 21.14 for an example. This is the default style for SAS/STAT documentation.
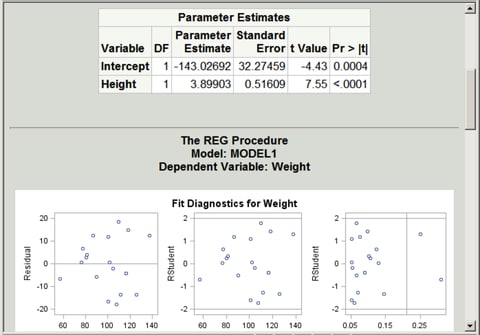
The ANALYSIS style is a color style with a somewhat different appearance from the STATISTICAL style. See Figure 21.8 for an example.
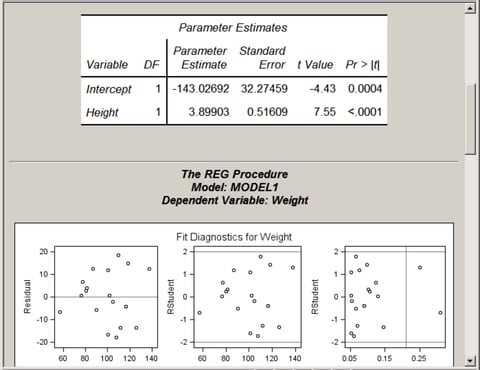
The JOURNAL family of styles (JOURNAL and JOURNAL2) consists of black-and-white or gray-scale styles that are recommended for graphs that appear in journals and in other black-and-white publications. See Figure 21.15 for an example of the JOURNAL style, see Figure 21.9 for an example of the JOURNAL2 style, and see Example 21.3 for a comparison of the two styles.
The RTF style is used to produce graphs to insert into a Microsoft Word document or a Microsoft PowerPoint slide. See Figure 21.11 for an example of the RTF style, which is the default style for the RTF destination.
There are many other styles including the LISTING style, which is the default style for the LISTING destination.
You specify a style with the STYLE= option in the ODS destination statement. For example, the following statement requests HTML output produced with the JOURNAL style:
ods html style=Journal;
Similarly, the following statement sets the style for the LISTING destination:
ods listing style=Statistical;
The style specified with the STYLE= option in the ODS LISTING statement applies only to graphs. The legacy SAS monospace format is used for tables.
The color styles are a compromise in the sense that some graph elements are intentionally over-distinguished to facilitate black-and-white printing. For example, fit lines that correspond to different classification levels are distinguished by both colors and line patterns. You can use the %MODSTYLE SAS autocall macro (see the sections Creating an All-Color Style by Using the ModStyle Macro and Style Template Modification Macro) to modify a style so that it relies only on color for distinguishability. More generally, you can modify the colors, fonts, and other attributes of graph elements in a style by editing the style definition template. More information is provided in the section Styles, and detailed information is in the SAS Output Delivery System: User's Guide.
Copyright © SAS Institute, Inc. All Rights Reserved.