| Statistical Graphics Using ODS |
Example 21.3 Creating Graphs in PostScript Files
This example illustrates how to create individual graphs in PostScript files. This is particularly useful when you want to include them in a LaTeX document. Consider again the data set Stack created by the following statements:
data stack;
   input  x1 x2 x3 y @@;
   datalines;
80  27  89  42    80  27  88  37    75  25  90  37

   ... more lines ...

;
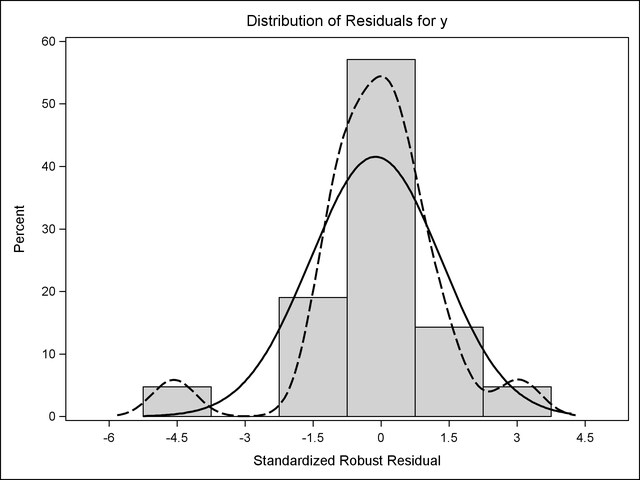
The following statements close the LISTING destination, open the LATEX destination with the JOURNAL style, and request a histogram of standardized robust residuals computed with PROC ROBUSTREG:
ods graphics on / reset=index;
ods listing close;
ods latex style=Journal;

proc robustreg data=stack plots=histogram;
   model y = x1 x2 x3;
run;

ods latex close;
ods listing;
The JOURNAL style displays gray-scale graphs that are suitable for a journal. When you specify the ODS LATEX destination, ODS creates a PostScript file for each individual graph in addition to a LaTeX source file that includes the tabular output and references to the PostScript files. By default, these files are saved in the SAS current folder. The histogram shown in Output 21.3.1 is saved by default in a file named Histogram.ps. See the section Naming Graphics Image Files for details about how graphics image files are named. If both the LISTING destination (which is open unless you explicitly close it) and the LATEX destination are open, then two files are created: Histogram.ps and Histogram1.ps. If the RESET=INDEX option is not specified in the ODS GRAPHICS statement, and if you run the step more than once, the final name is based on an incremented index.
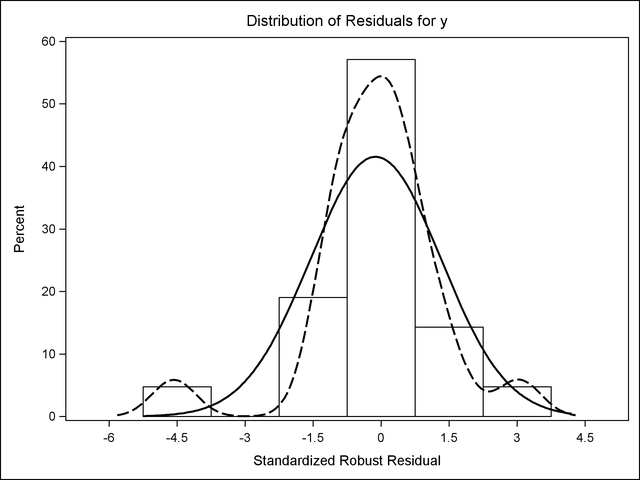
You can use the JOURNAL2 style for a different appearance—the bars are not filled. The following step produces Output 21.3.2:
ods graphics on / reset=index;
ods listing close;
ods latex style=Journal2;

proc robustreg data=stack plots=histogram;
   model y = x1 x2 x3;
run;

ods latex close;
ods listing;
If you are writing a paper, you can include the graphs in your own LaTeX source file by referencing the names of the individual PostScript graphics files. In this situation, you might not find it necessary to use the LaTeX source file created by SAS. Alternatively, you can include PNG files into a LaTeX document, after using some other ODS destination (such as HTML) to create the PNG files.
Copyright © SAS Institute, Inc. All Rights Reserved.