| The LOGISTIC Procedure |
| The Hosmer-Lemeshow Goodness-of-Fit Test |
Sufficient replication within subpopulations is required to make the Pearson and deviance goodness-of-fit tests valid. When there are one or more continuous predictors in the model, the data are often too sparse to use these statistics. Hosmer and Lemeshow (2000) proposed a statistic that they show, through simulation, is distributed as chi-square when there is no replication in any of the subpopulations. This test is available only for binary response models.
First, the observations are sorted in increasing order of their estimated event probability. The event is the response level specified in the response variable option EVENT=, or the response level that is not specified in the REF= option, or, if neither of these options was specified, then the event is the response level identified in the "Response Profiles" table as "Ordered Value 1". The observations are then divided into approximately 10 groups according to the following scheme. Let  be the total number of subjects. Let
  be the target number of subjects for each group given by
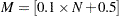 |
where  represents the integral value of
  . If the single-trial syntax is used, blocks of subjects are formed of observations with identical values of the explanatory variables. Blocks of subjects are not divided when being placed into groups.
Suppose there are  subjects in the first block and
  subjects in the second block. The first block of subjects is placed in the first group. Subjects in the second block are added to the first group if
 |
Otherwise, they are placed in the second group. In general, suppose subjects of the ( )th block have been placed in the
  th group. Let
  be the total number of subjects currently in the th group. Subjects for the
  th block (containing
  subjects) are also placed in the th group if
 |
Otherwise, the subjects are put into the next group. In addition, if the number of subjects in the last group does not exceed  (half the target group size), the last two groups are collapsed to form only one group.
Note that the number of groups,  , can be smaller than 10 if there are fewer than 10 patterns of explanatory variables. There must be at least three groups in order for the Hosmer-Lemeshow statistic to be computed.
The Hosmer-Lemeshow goodness-of-fit statistic is obtained by calculating the Pearson chi-square statistic from the  table of observed and expected frequencies, where is the number of groups. The statistic is written
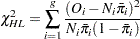 |
where  is the total frequency of subjects in the
  th group,
  is the total frequency of event outcomes in the th group, and
  is the average estimated predicted probability of an event outcome for the th group. (Note that the predicted probabilities are computed as shown in the section Linear Predictor, Predicted Probability, and Confidence Limits and are not the cross validated estimates discussed in the section Classification Table.) The Hosmer-Lemeshow statistic is then compared to a chi-square distribution with
  degrees of freedom, where the value of
  can be specified in the LACKFIT option in the MODEL statement. The default is
  . Large values of
  (and small p-values) indicate a lack of fit of the model.
Copyright © SAS Institute, Inc. All Rights Reserved.