The RAREEVENTS Procedure(Experimental)

Example 16.2 Airline Crashes
The following statements create a SAS data set that contains data from the National Transportation Safety Board (NTSB) Aviation
Accident Database. You can query the database at http://www.ntsb.gov/_layouts/ntsb.aviation/index.aspx. These data involve commercial airline crashes that resulted in fatalities and took place in the United States from 1982
through 2013. The DATA step creates a new variable, DaysBetweenCrashes, that records the number of days between successive crashes.
data AirCrashes;
   input EventID : $14. EventDate mmddyy10. Location & $32.;
   DaysBetweenCrashes = EventDate - lag(EventDate);
   label DaysBetweenCrashes = 'Days';
datalines;
20020917X01907 01/13/1982 WASHINGTON, DC
20020917X01909 01/23/1982 BOSTON, MA
20020917X03104 07/09/1982 NEW ORLEANS, LA
20020917X04908 11/11/1982 MIAMI, FL
20001214X41967 01/09/1983 BRAINERD, MN
20001214X41968 01/11/1983 DETROIT, MI
20001214X44795 10/11/1983 PINCKNEYVILLE, IL
20001214X45258 12/20/1983 SIOUX FALLS, SD
20001214X39535 05/30/1984 CHALKHILL, PA
20001214X35492 01/09/1985 KANSAS CITY, KS
20001214X35493 01/21/1985 RENO, NV
20001214X36375 05/31/1985 NASHVILLE, TN
20001214X37434 08/02/1985 DALLAS/FT WORTH, TX
20001214X37757 09/06/1985 MILWAUKEE, WI
20001213X34942 10/04/1986 KELLY AFB, TX
20001213X35148 11/06/1986 TAMPA, FL
20001213X30626 04/13/1987 KANSAS CITY, MO
20001213X31759 08/16/1987 ROMULUS, MI
20001213X32505 11/15/1987 DENVER, CO
20001213X32679 12/07/1987 SAN LUIS OBISPO, CA
20001213X25439 04/28/1988 MAUI, HI
20001213X26528 08/31/1988 DALLAS/FT WORTH, TX
20001213X27734 02/09/1989 SALT LAKE CITY, UT
20001213X27705 02/24/1989 HONOLULU, HI
20001213X27867 03/15/1989 WEST LAFAYETTE, IN
20001213X27869 03/18/1989 SAGINAW, TX
20001213X28786 07/19/1989 SIOUX CITY, IA
20001213X29335 09/20/1989 FLUSHING, NY
20001213X29644 10/07/1989 ORLANDO, FL
20001213X29997 12/27/1989 MIAMI, FL
20001212X22400 01/18/1990 ATLANTA, GA
20001212X22386 01/31/1990 INDIANAPOLIS, IN
20001212X22742 03/13/1990 PHOENIX, AZ
20001212X24506 10/03/1990 CAPE CANAVERAL, FL
20001212X24751 12/03/1990 ROMULUS, MI
20001212X24751 12/03/1990 ROMULUS, MI
20001212X16433 02/01/1991 LOS ANGELES, CA
20001212X16434 02/17/1991 CLEVELAND, OH
20001212X16583 03/03/1991 COLORADO SPGS, CO
20001212X18366 10/12/1991 BRIDGEPORT, CT
20001211X14094 02/15/1992 SWANTON, OH
20001211X14270 03/22/1992 FLUSHING, NY
20001211X14503 04/08/1992 DAYTON, OH
20001211X16222 12/08/1992 FLUSHING, NY
20001211X12079 04/04/1993 CHICAGO, IL
20001206X01727 07/02/1994 CHARLOTTE, NC
20001206X02233 09/08/1994 ALIQUIPPA, PA
20001206X02420 10/31/1994 ROSELAWN, IN
20001206X02586 11/22/1994 BRIDGETON, MO
20001208X05743 05/11/1996 MIAMI, FL
20001208X06203 07/06/1996 PENSACOLA, FL
20001208X06204 07/17/1996 EAST MORICHES, NY
20001208X06132 07/20/1996 RUSSIAN MISSION, AK
20001208X07619 03/27/1997 JAMAICA, NY
20001208X08607 08/07/1997 MIAMI, FL
20001208X09291 12/28/1997 PACIFIC OCEAN
20001212X18961 06/01/1999 LITTLE ROCK, AR
20001212X19260 07/28/1999 LITTLE ROCK, AR
20001212X20339 01/31/2000 Port Hueneme, CA
20001212X20472 02/16/2000 RANCHO CORDOVA, CA
20001212X22314 11/20/2000 MIAMI, FL
20010904X01867 08/05/2001 Washington, DC
20020123X00106 09/11/2001 Shanksville, PA
20020123X00105 09/11/2001 Arlington, VA
20020123X00104 09/11/2001 New York City, NY
20020123X00103 09/11/2001 New York City, NY
20011130X02321 11/12/2001 Belle Harbor, NY
20030110X00049 01/08/2003 Charlotte, NC
20030917X01555 09/12/2003 Norfolk, VA
20040825X01286 08/13/2004 Florence, KY
20041020X01659 10/19/2004 Kirksville, MO
20050609X00744 06/07/2005 Washington, DC
20051213X01964 12/08/2005 Chicago, IL
20060106X00018 12/19/2005 Miami, FL
20060131X00140 01/16/2006 El Paso, TX
20060828X01244 08/27/2006 Lexington, KY
20070718X00958 07/10/2007 Tunica, MS
20090213X13613 02/12/2009 Clarence Center, NY
20130814X15751 08/14/2013 Birmingham, AL
;
The following statements produce a comparison plot and a rare events chart for DaysBetweenCrashes:
proc rareevents data=AirCrashes;
   id EventId EventDate Location;
   compare DaysBetweenCrashes /
      odstitle='Distribution of Days between Fatal Commercial Air Crashes'
      odstitle2='United States, 1982-2013'
      ;
   chart DaysBetweenCrashes /
      odstitle='Days between Fatal Commercial Air Crashes'
      odstitle2='United States, 1982-2013'
      nohlabel
      ;
run;
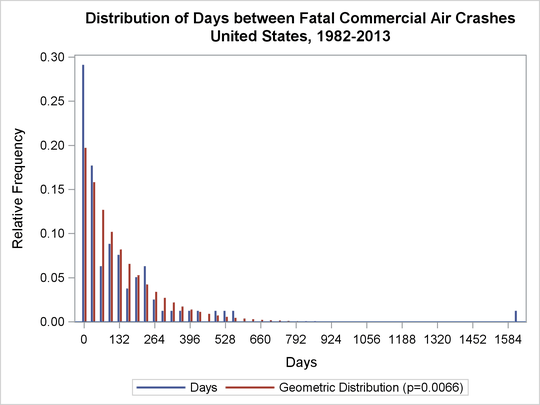
The ODSTITLE= and ODSTITLE2= options specify titles for the graphs. The NOHLABEL option suppresses the horizontal axis label in the rare events chart. Output 16.2.1 compares the data to a geometric distribution and indicates that the distribution reasonably describes the data.
Output 16.2.1: Comparison Plot for Days between Crashes
Output 16.2.2 and Output 16.2.3 show the two panels of the chart.
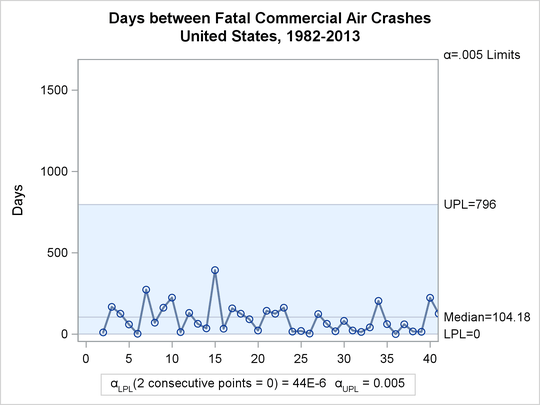
Output 16.2.2: Rare Events Chart for Air Crashes (Panel 1)
Output 16.2.3: Rare Events Chart for Air Crashes (Panel 2)
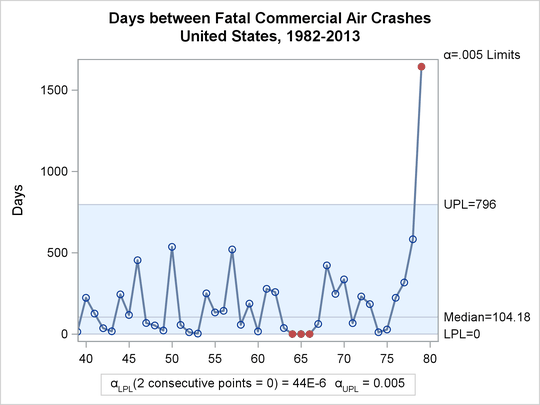
In Output 16.2.3, the three consecutive points equal to the LPL that signal unusual variation correspond to the terrorist attacks on September 11, 2001. Note that the counts of days between crashes are generally smaller in the first panel of the chart (Output 16.2.2) than in the second panel. Those measurements correspond approximately to the years from 1982 to 1992.
There appears to have been a significant change in the process around that time. The following statements create a variable
called Years that divides the data into periods before and after the end of 1992. A rare events chart is produced for the first period.
data AirCrashes2;
   set AirCrashes;
   if EventDate <= '31dec1992'd then
      Years = '1982-1992';
   else
      Years = '1993-2013';
run;
proc rareevents data=AirCrashes2;
   id EventId EventDate Location;
   where Years = '1982-1992';
   chart DaysBetweenCrashes /
      odstitle='Days between Fatal Commercial Air Crashes'
      odstitle2='1982-1992'
      nohlabel
      outlimits=AirLimits ;
run;
The OUTLIMITS=
option in the CHART statement saves the probability limits in the data set AirLimits. Output 16.2.4 shows the rare events chart for the years 1982–1992.
Output 16.2.4: Rare Events Chart for Air Crashes (1982–1992)
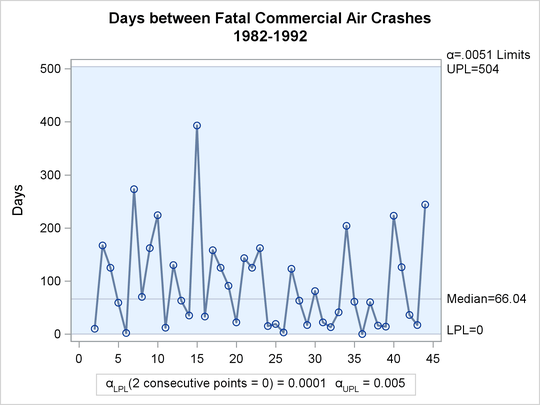
Note the difference in probability limits between Output 16.2.4 and Output 16.2.2, whose limits were computed using all the data. The new chart indicates a stable process from 1982 to 1992.
The following statements create a rare events chart for the years 1993 to 2013, with the data that correspond to the September 11 crashes removed from the analysis:
proc rareevents data=AirCrashes2 limits=AirLimits;
   id EventId EventDate Location;
   where Years = '1993-2013' and EventDate ne '11sep2001'd;
   chart DaysBetweenCrashes /
      odstitle='Days between Fatal Commercial Air Crashes'
      odstitle2='1993-2013'
      nohlabel;
run;
The LIMITS= option applies the historical probability limits computed for the earlier period to these data. Output 16.2.5 shows the rare events chart for the years 1993 to 2013.
Output 16.2.5: Rare Events Chart for Air Crashes (1993–2013)
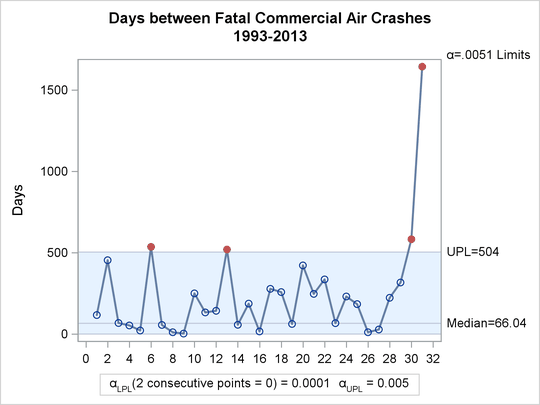
You can see that 4 of 32 measurements on the chart exceed the UPL that was computed from data for the years 1982 to 1992. This is strong evidence of a change in the process, with fatal airline crashes becoming less frequent.