The RELIABILITY Procedure
- Overview
-
Getting Started
 Analysis of Right-Censored Data from a Single PopulationWeibull Analysis Comparing Groups of DataAnalysis of Accelerated Life Test DataWeibull Analysis of Interval Data with Common Inspection ScheduleLognormal Analysis with Arbitrary CensoringRegression ModelingRegression Model with Nonconstant ScaleRegression Model with Two Independent VariablesWeibull Probability Plot for Two Combined Failure ModesAnalysis of Recurrence Data on RepairsComparison of Two Samples of Repair DataAnalysis of Interval Age Recurrence DataAnalysis of Binomial DataThree-Parameter WeibullParametric Model for Recurrent Events DataParametric Model for Interval Recurrent Events Data
 -
SyntaxPrimary StatementsSecondary StatementsGraphical Enhancement StatementsPROC RELIABILITY StatementANALYZE StatementBY StatementCLASS StatementDISTRIBUTION StatementEFFECTPLOT StatementESTIMATE StatementFMODE StatementFREQ StatementINSET StatementLOGSCALE StatementLSMEANS StatementLSMESTIMATE StatementMAKE StatementMCFPLOT StatementMODEL StatementNENTER StatementNLOPTIONS StatementPROBPLOT StatementRELATIONPLOT StatementSLICE StatementSTORE StatementTEST StatementUNITID Statement
-
DetailsAbbreviations and NotationTypes of Lifetime DataProbability DistributionsProbability PlottingNonparametric Confidence Intervals for Cumulative Failure ProbabilitiesParameter Estimation and Confidence IntervalsRegression Model Statistics Computed for Each Observation for Lifetime DataRegression Model Statistics Computed for Each Observation for Recurrent Events DataRecurrence Data from Repairable SystemsODS Table NamesODS Graphics
- References
Three-Parameter Weibull
Meeker and Escobar (1998) give an example of the number of cycles to fatigue failure of specimens of a certain alloy. The first 67 specimens experienced
failure, and the last five specimens had no failure at 300,000 cycles. The following statements create a SAS data set named
Alloy that contains the number of cycles (in thousands) to failure or end of test for the specimens:
data Alloy;
   input kCycles@@;
   Cen = _n_ > 67;
   label kCycles = 'Fatigue Life in Thousands of Cycles';
   datalines;
94  96  99  99  104 108 112 114 117 117
118 121 121 123 129 131 133 135 136 139
139 140 141 141 143 144 149 149 152 153
159 159 159 159 162 168 168 169 170 170
171 172 173 176 177 180 180 184 187 188
189 190 196 197 203 205 211 213 224 226
227 256 257 269 271 274 291 300 300 300
300 300
;
The following SAS statements fit a three-parameter Weibull distribution to the specimen lifetimes, in thousands of cycles. The PROFILE option requests a profile likelihood plot for the threshold parameter. ODS Graphics must be enabled to create a profile likelihood plot with the PROFILE option.
proc Reliability data=Alloy;
   distribution Weibull3;
   Pplot kCycles*Cen(1) / Profile(noconf range=(50,100)) LifeUpper=500;
run;
Figure 16.45 shows the maximum likelihood estimates of the Weibull threshold, shape and scale parameters, and the corresponding extreme value location and scale parameter estimates.
Figure 16.45: Three-Parameter Weibull Parameter Estimates
| Three-Parameter Weibull Parameter Estimates | ||||
|---|---|---|---|---|
| Parameter | Estimate | Standard Error | Asymptotic Normal | |
| 95% Confidence Limits | ||||
| Lower | Upper | |||
| EV Location | 4.5354 | 0.1009 | 4.3377 | 4.7332 |
| EV Scale | 0.7575 | 0.0898 | 0.6005 | 0.9556 |
| Weibull Scale | 93.2642 | 9.4082 | 76.5329 | 113.6531 |
| Weibull Shape | 1.3202 | 0.1565 | 1.0465 | 1.6654 |
| Weibull Threshold | 92.9928 | 1.9516 | 89.1676 | 96.8179 |
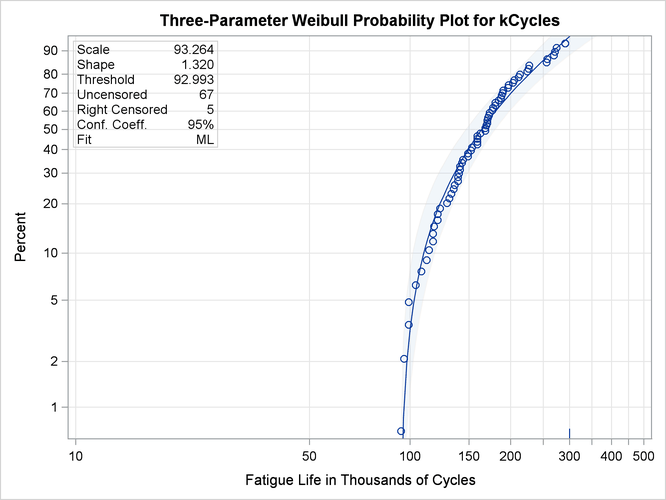
A probability plot of the failure lifetimes and the fitted three-parameter Weibull distribution is shown in Figure 16.46.
Figure 16.46: Three-Parameter Weibull Probability Plot
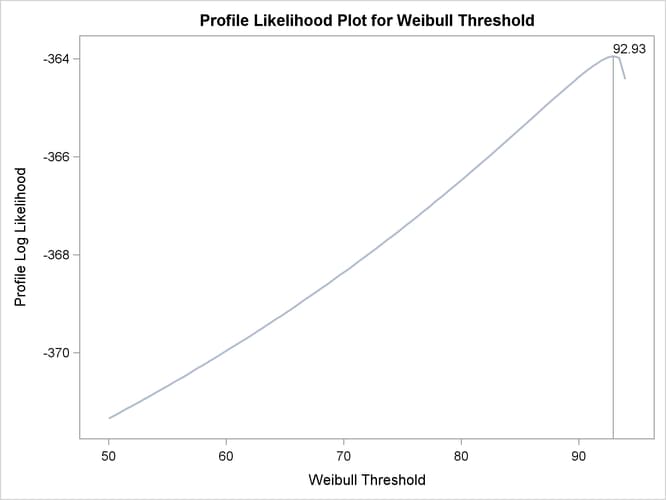
A profile likelihood plot for the threshold parameter is shown in Figure 16.47. The threshold value at the maximum log likelihood corresponds to the maximum likelihood estimate of the threshold parameter.
Figure 16.47: Profile Likelihood for Three-Parameter Weibull Threshold