The RELIABILITY Procedure
- Overview
-
Getting Started
 Analysis of Right-Censored Data from a Single PopulationWeibull Analysis Comparing Groups of DataAnalysis of Accelerated Life Test DataWeibull Analysis of Interval Data with Common Inspection ScheduleLognormal Analysis with Arbitrary CensoringRegression ModelingRegression Model with Nonconstant ScaleRegression Model with Two Independent VariablesWeibull Probability Plot for Two Combined Failure ModesAnalysis of Recurrence Data on RepairsComparison of Two Samples of Repair DataAnalysis of Interval Age Recurrence DataAnalysis of Binomial DataThree-Parameter WeibullParametric Model for Recurrent Events DataParametric Model for Interval Recurrent Events Data
 -
SyntaxPrimary StatementsSecondary StatementsGraphical Enhancement StatementsPROC RELIABILITY StatementANALYZE StatementBY StatementCLASS StatementDISTRIBUTION StatementEFFECTPLOT StatementESTIMATE StatementFMODE StatementFREQ StatementINSET StatementLOGSCALE StatementLSMEANS StatementLSMESTIMATE StatementMAKE StatementMCFPLOT StatementMODEL StatementNENTER StatementNLOPTIONS StatementPROBPLOT StatementRELATIONPLOT StatementSLICE StatementSTORE StatementTEST StatementUNITID Statement
-
DetailsAbbreviations and NotationTypes of Lifetime DataProbability DistributionsProbability PlottingNonparametric Confidence Intervals for Cumulative Failure ProbabilitiesParameter Estimation and Confidence IntervalsRegression Model Statistics Computed for Each Observation for Lifetime DataRegression Model Statistics Computed for Each Observation for Recurrent Events DataRecurrence Data from Repairable SystemsODS Table NamesODS Graphics
- References
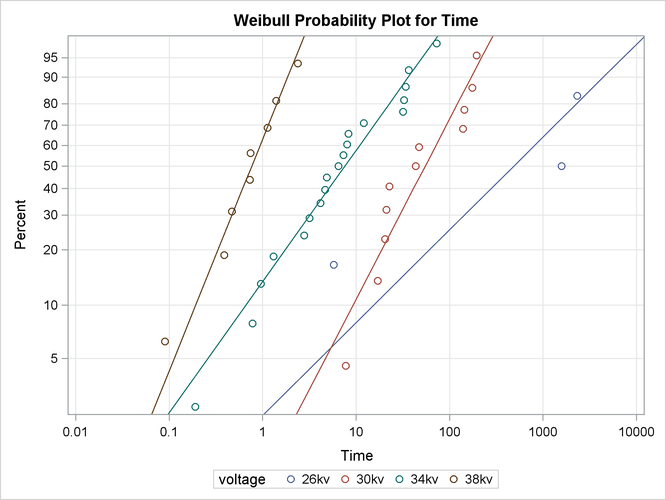
Weibull Analysis Comparing Groups of Data
This example illustrates probability plotting and distribution fitting for data grouped by the levels of a special group-variable. The data are from an accelerated life test of an insulating fluid and are the times to electrical breakdown of the fluid under different high voltage levels. Each voltage level defines a subset of data for which a separate analysis and Weibull plot are produced. These data are the 26kV, 30kV, 34kV, and 38kV groups of the data provided by Nelson (1990, p. 129). The following statements create a SAS data set containing the lifetimes and voltages:
data fluid;
   input Time voltage $ @@;
   datalines;
5.79    26kv    1579.52 26kv
2323.7  26kv    7.74    30kv
17.05   30kv    20.46   30kv
21.02   30kv    22.66   30kv
43.4    30kv    47.3    30kv
139.07  30kv    144.12  30kv
175.88  30kv    194.90  30kv
0.19     34kv    .78     34kv
0.96     34kv    1.31    34kv
2.78    34kv    3.16    34kv
4.15    34kv    4.67    34kv
4.85    34kv    6.50    34kv
7.35    34kv    8.01    34kv
8.27    34kv    12.06   34kv
31.75   34kv    32.52   34kv
33.91   34kv    36.71   34kv
72.89   34kv    .09     38kv
0.39     38kv    .47     38kv
0.73     38kv    .74     38kv
1.13    38kv    1.40    38kv
2.38    38kv
;
The variable Time provides the time to breakdown in minutes, and the variable Voltage provides the voltage level at which the test was conducted. These data are not censored.
The RELIABILITY procedure plots the data for the different voltage levels on the same Weibull probability plot, fits a separate distribution to the data at each voltage level, and superimposes distribution lines on the plot.
The following statements produce the probability plot shown in Figure 16.5 for the variable Time at each level of the group-variable Voltage:
proc reliability data=fluid;
   distribution Weibull;
   pplot time=voltage  / overlay
                         noconf;
run;
The input data set FLUID is specified by the DATA= option in the PROC RELIABILITY statement. The PROBPLOT statement option OVERLAY specifies that plots for the groups are to be overlaid rather than displayed separately. The option NOCONF specifies that no confidence bands are to be plotted, since these can interfere with one another on overlaid plots; confidence bands are displayed by default.
Figure 16.5: Weibull Probability Plot for the Insulating Fluid Data
A summary table that contains information for all groups is displayed. In addition, information identical to that shown in Figure 16.3 is tabulated for each level of voltage. The summary table for all groups and the tables for the 26kV group are shown in Figure 16.6 and Figure 16.7.
Figure 16.6: Partial Listing of the Tabular Output for the Insulating Fluid Data
| Model Information - All Groups | |
|---|---|
| Input Data Set | WORK.FLUID |
| Analysis Variable | Time |
| Distribution | Weibull |
| Estimation Method | Maximum Likelihood |
| Confidence Coefficient | 95% |
| Observations Used | 41 |
| Algorithm converged for group 26kv. |
| Summary of Fit | ||
|---|---|---|
| Group | ||
| Observations Used | 3 | 26kv |
| Uncensored Values | 3 | 26kv |
| Maximum Loglikelihood | -6.845551 | 26kv |
Figure 16.7: Partial Listing of the Tabular Output for the Insulating Fluid Data
| Model Information - All Groups | |
|---|---|
| Input Data Set | WORK.FLUID |
| Analysis Variable | Time |
| Distribution | Weibull |
| Estimation Method | Maximum Likelihood |
| Confidence Coefficient | 95% |
| Observations Used | 41 |
| Weibull Parameter Estimates | |||||
|---|---|---|---|---|---|
| Parameter | Estimate | Standard Error | Asymptotic Normal | Group | |
| 95% Confidence Limits | |||||
| Lower | Upper | ||||
| EV Location | 6.8625 | 1.1040 | 4.6986 | 9.0264 | 26kv |
| EV Scale | 1.8342 | 0.9611 | 0.6568 | 5.1226 | 26kv |
| Weibull Scale | 955.7467 | 1055.1862 | 109.7941 | 8319.6794 | 26kv |
| Weibull Shape | 0.5452 | 0.2857 | 0.1952 | 1.5226 | 26kv |
| Other Weibull Distribution Parameters | ||
|---|---|---|
| Parameter | Value | Group |
| Mean | 1649.4882 | 26kv |
| Mode | 0.0000 | 26kv |
| Median | 487.9547 | 26kv |
| Standard Deviation | 3279.0212 | 26kv |
| Weibull Percentile Estimates | |||||
|---|---|---|---|---|---|
| Percent | Estimate | Standard Error | Asymptotic Normal | Group | |
| 95% Confidence Limits | |||||
| Lower | Upper | ||||
| 0.1 | 0.00300636 | 0.02113841 | 3.11203E-9 | 2904.27046 | 26kv |
| 0.2 | 0.01072998 | 0.06838144 | 4.03597E-8 | 2852.65767 | 26kv |
| 0.5 | 0.0577713 | 0.31803193 | 1.19079E-6 | 2802.78862 | 26kv |
| 1 | 0.20695478 | 1.00385021 | 0.00001538 | 2784.16263 | 26kv |
| 2 | 0.74484901 | 3.12705686 | 0.00019885 | 2790.0941 | 26kv |
| 5 | 4.1142692 | 13.7388263 | 0.00591379 | 2862.3304 | 26kv |
| 10 | 15.406565 | 41.4763373 | 0.07873508 | 3014.69497 | 26kv |
| 20 | 61.0231127 | 125.020566 | 1.10053199 | 3383.65475 | 26kv |
| 30 | 144.246801 | 242.203982 | 5.36856883 | 3875.73303 | 26kv |
| 40 | 278.770459 | 398.048692 | 16.9761581 | 4577.77125 | 26kv |
| 50 | 487.954708 | 610.02855 | 42.0948552 | 5656.26835 | 26kv |
| 60 | 814.147288 | 920.537706 | 88.770543 | 7466.84412 | 26kv |
| 70 | 1343.42243 | 1433.97868 | 165.818889 | 10884.0666 | 26kv |
| 80 | 2287.87124 | 2445.52431 | 281.5628 | 18590.3635 | 26kv |
| 90 | 4412.96962 | 5148.34986 | 448.419608 | 43428.7452 | 26kv |
| 95 | 7150.89745 | 9248.2654 | 566.892142 | 90202.9338 | 26kv |
| 99 | 15735.8513 | 24666.0388 | 728.831025 | 339745.437 | 26kv |
| 99.9 | 33104.172 | 62018.1074 | 841.826189 | 1301796.28 | 26kv |