The UNIVARIATE Procedure
- Overview
-
Getting Started

-
Syntax
-
DetailsMissing ValuesRoundingDescriptive StatisticsCalculating the ModeCalculating PercentilesTests for LocationConfidence Limits for Parameters of the Normal DistributionRobust EstimatorsCreating Line Printer PlotsCreating High-Resolution GraphicsUsing the CLASS Statement to Create Comparative PlotsPositioning InsetsFormulas for Fitted Continuous DistributionsGoodness-of-Fit TestsKernel Density EstimatesConstruction of Quantile-Quantile and Probability PlotsInterpretation of Quantile-Quantile and Probability PlotsDistributions for Probability and Q-Q PlotsEstimating Shape Parameters Using Q-Q PlotsEstimating Location and Scale Parameters Using Q-Q PlotsEstimating Percentiles Using Q-Q PlotsInput Data SetsOUT= Output Data Set in the OUTPUT StatementOUTHISTOGRAM= Output Data SetOUTKERNEL= Output Data SetOUTTABLE= Output Data SetTables for Summary StatisticsODS Table NamesODS Tables for Fitted DistributionsODS GraphicsComputational Resources
-
ExamplesComputing Descriptive Statistics for Multiple VariablesCalculating ModesIdentifying Extreme Observations and Extreme ValuesCreating a Frequency TableCreating Basic Summary PlotsAnalyzing a Data Set With a FREQ VariableSaving Summary Statistics in an OUT= Output Data SetSaving Percentiles in an Output Data SetComputing Confidence Limits for the Mean, Standard Deviation, and VarianceComputing Confidence Limits for Quantiles and PercentilesComputing Robust EstimatesTesting for LocationPerforming a Sign Test Using Paired DataCreating a HistogramCreating a One-Way Comparative HistogramCreating a Two-Way Comparative HistogramAdding Insets with Descriptive StatisticsBinning a HistogramAdding a Normal Curve to a HistogramAdding Fitted Normal Curves to a Comparative HistogramFitting a Beta CurveFitting Lognormal, Weibull, and Gamma CurvesComputing Kernel Density EstimatesFitting a Three-Parameter Lognormal CurveAnnotating a Folded Normal CurveCreating Lognormal Probability PlotsCreating a Histogram to Display Lognormal FitCreating a Normal Quantile PlotAdding a Distribution Reference LineInterpreting a Normal Quantile PlotEstimating Three Parameters from Lognormal Quantile PlotsEstimating Percentiles from Lognormal Quantile PlotsEstimating Parameters from Lognormal Quantile PlotsComparing Weibull Quantile PlotsCreating a Cumulative Distribution PlotCreating a P-P Plot
- References
Example 4.5 Creating Basic Summary Plots
The PLOTS option in the PROC UNIVARIATE statement requests several basic summary plots. For more information about plots created by the PLOTS option, see the section Creating Line Printer Plots. This example illustrates the use of the PLOT option as well as BY processing in PROC UNIVARIATE.
A researcher is analyzing a data set consisting of air pollution data from three different measurement sites. The data set
AirPoll, created by the following statements, contains the variables Site and Ozone, which are the site number and ozone level, respectively.
data AirPoll (keep = Site Ozone);
   label Site  = 'Site Number'
         Ozone = 'Ozone level (in ppb)';
   do i = 1 to 3;
      input Site @@;
      do j = 1 to 15;
         input Ozone @@;
         output;
      end;
   end;
   datalines;
102 4 6 3 4 7 8 2 3 4 1 3 8 9 5 6
134 5 3 6 2 1 2 4 3 2 4 6 4 6 3 1
137 8 9 7 8 6 7 6 7 9 8 9 8 7 8 5
;
The following statements produce basic plots for each site in the AirPoll data set:
ods graphics off;
ods select Plots SSPlots;
proc univariate data=AirPoll plot;
   by Site;
   var Ozone;
run;
The ODS GRAPHICS OFF statement specified before the PROC statement disables ODS Graphics, which causes the PLOTS option to
produce legacy line printer plots. The PLOTS option produces a stem-and-leaf plot, a box plot, and a normal probability plot
for the Ozone variable at each site. Because a BY statement is specified, a side-by-side box plot is also created to compare the ozone
levels across sites. Note that AirPoll is sorted by Site; in general, the data set should be sorted by the BY variable by using the SORT procedure. The ODS SELECT statement restricts
the output to the "Plots" and "SSPlots" tables; see the section ODS Table Names. Optionally, you can specify the PLOTSIZE=n option to control the approximate number of rows (between 8 and the page size) that the plots occupy.
Output 4.5.1 through Output 4.5.3 show the plots produced for each BY group. Output 4.5.4 shows the side-by-side box plot for comparing Ozone values across sites.
Output 4.5.1: Ozone Plots for BY Group Site = 102
| Analysis of Score Changes |
                Stem Leaf                     #             Boxplot
                   9 0                        1                |
                   8 00                       2                |
                   7 0                        1             +-----+
                   6 00                       2             |     |
                   5 0                        1             |     |
                   4 000                      3             *--+--*
                   3 000                      3             +-----+
                   2 0                        1                |
                   1 0                        1                |
                     ----+----+----+----+


                                 Normal Probability Plot
               9.5+                                          *++++
                  |                                  *  * ++++
                  |                                * +++++
                  |                            * *+++
               5.5+                          +*++
                  |                      **+*
                  |                * *+*+
                  |             *++++
               1.5+        *++++
                   +----+----+----+----+----+----+----+----+----+----+
                       -2        -1         0        +1        +2
|
Output 4.5.2: Ozone Plots for BY Group Site = 134
| Analysis of Score Changes |
                Stem Leaf                     #             Boxplot
                   6 000                      3                |
                   5 0                        1             +-----+
                   4 000                      3             |     |
                   3 000                      3             *--+--*
                   2 000                      3             +-----+
                   1 00                       2                |
                     ----+----+----+----+


                                 Normal Probability Plot
               6.5+                                  *  *  ++*+++
                  |                                * ++++++
                  |                           **+*+++
                  |                      **+*+++
                  |                *+*+*++
               1.5+        *  ++*+++
                   +----+----+----+----+----+----+----+----+----+----+
                       -2        -1         0        +1        +2
|
Output 4.5.3: Ozone Plots for BY Group Site = 137
| Analysis of Score Changes |
                Stem Leaf                     #             Boxplot
                   9 000                      3                |
                   8                                           |
                   8 00000                    5             +-----+
                   7                                        |  +  |
                   7 0000                     4             +-----+
                   6                                           |
                   6 00                       2                |
                   5
                   5 0                        1                0
                     ----+----+----+----+


                                 Normal Probability Plot
              9.25+                                  *  *++++*
                  |                                  ++++
                  |                         * ** *+*+
                  |                          ++++
              7.25+                  * * **++
                  |                 +++++
                  |             *++*
                  |         ++++
              5.25+     +++*
                   +----+----+----+----+----+----+----+----+----+----+
                       -2        -1         0        +1        +2
|
Output 4.5.4: Ozone Side-by-Side Boxplot for All BY Groups
| Analysis of Score Changes |
                    |
                  9 +            |                       |
                    |            |                       |
                    |            |                       |
                    |            |                       |
                  8 +            |                    *-----*
                    |            |                    |     |
                    |            |                    |  +  |
                    |            |                    |     |
                  7 +         +-----+                 +-----+
                    |         |     |                    |
                    |         |     |                    |
                    |         |     |                    |
                  6 +         |     |        |           |
                    |         |     |        |
                    |         |     |        |
                    |         |     |        |
                  5 +         |     |     +-----+        0
                    |         |  +  |     |     |
                    |         |     |     |     |
                    |         |     |     |     |
                  4 +         *-----*     |     |
                    |         |     |     |     |
                    |         |     |     |  +  |
                    |         |     |     |     |
                  3 +         +-----+     *-----*
                    |            |        |     |
                    |            |        |     |
                    |            |        |     |
                  2 +            |        +-----+
                    |            |           |
                    |            |           |
                    |            |           |
                  1 +            |           |
                     ------------+-----------+-----------+-----------
               Site               102         134         137
|
The following statements produce basic plots by using ODS Graphics:
ods graphics on;
ods select Plots SSPlots;
proc univariate data=AirPoll plot;
   by Site;
   var Ozone;
run;
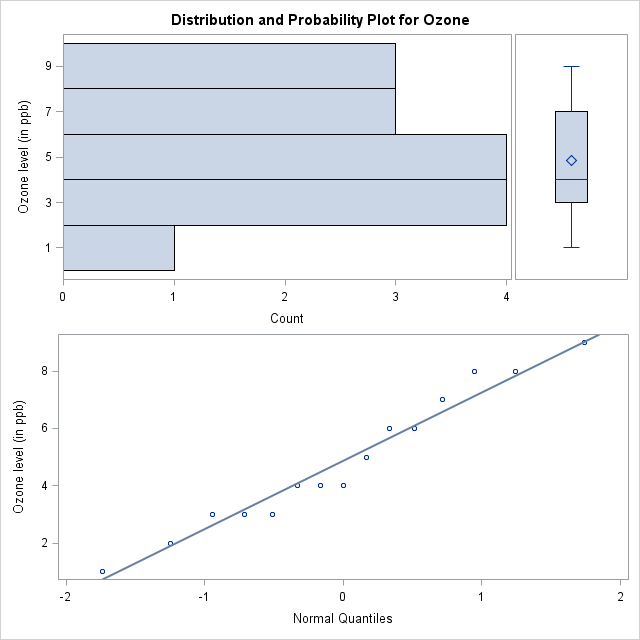
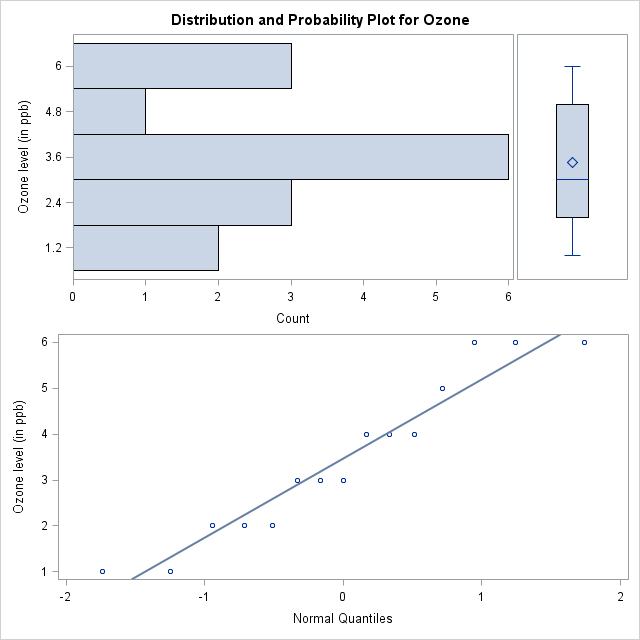
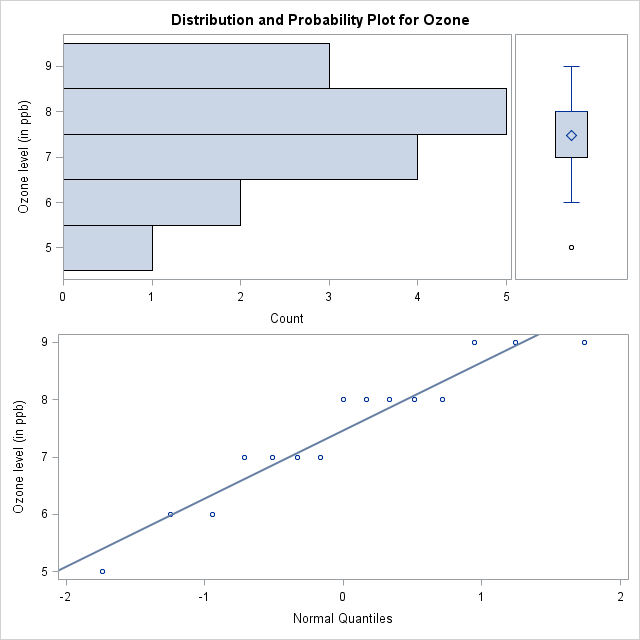
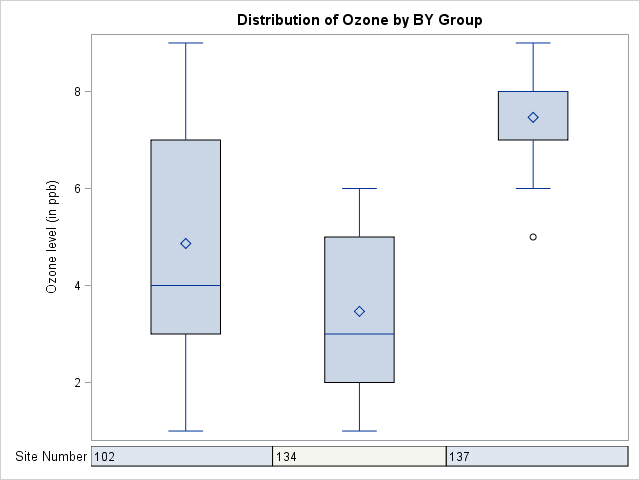
Output 4.5.5 through Output 4.5.8 show the plots produced by using ODS Graphics. Note that the line printer stem-and-leaf plots are replaced by horizontal histograms in ODS Graphics output.
Output 4.5.5: Ozone Plots for BY Group Site = 102
Output 4.5.6: Ozone Plots for BY Group Site = 134
Output 4.5.7: Ozone Plots for BY Group Site = 137
Output 4.5.8: Ozone Side-by-Side Boxplot for All BY Groups
Note: You can use the PROBPLOT statement with the NORMAL option to produce high-resolution normal probability plots; see the section Modeling a Data Distribution. You can use the BOXPLOT procedure to produce box plots that use high-resolution graphics. See Chapter 28: The BOXPLOT Procedure in SAS/STAT 14.1 User's Guide.
A sample program for this example, uniex04.sas, is available in the SAS Sample Library for Base SAS software.