CHART Procedure

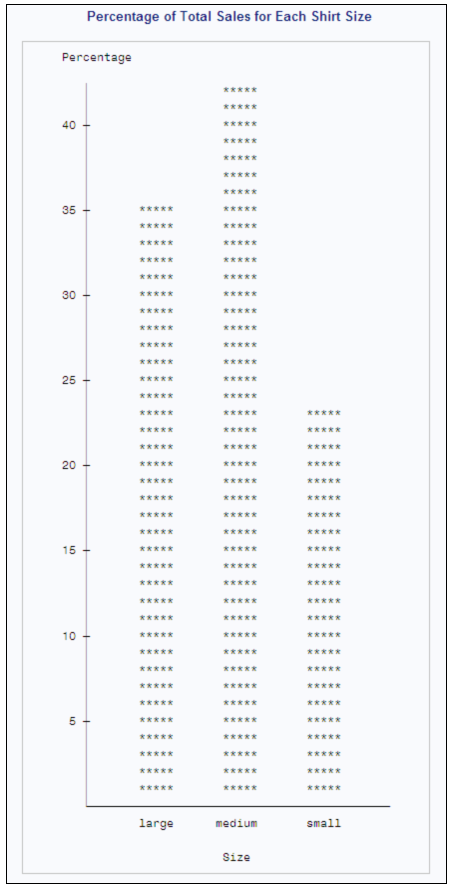
Example 2: Producing a Percentage Bar Chart

Features:

VBAR statement option: TYPE=

Data set: SHIRTS

Details

This example produces a vertical bar chart. The chart statistic is the percentage for each category of the total number of shirts sold.

Program

proc chart data=shirts;
   vbar size / type=percent;
   title 'Percentage of Total Sales for Each Shirt Size';
run;

Program Description

Create a vertical bar chart with percentages. The VBAR statement produces a vertical bar chart. TYPE= specifies percentage as the chart statistic for the variable Size.
proc chart data=shirts;
   vbar size / type=percent;
Specify the title.
   title 'Percentage of Total Sales for Each Shirt Size';
run;

Output: HTML

The following chart shows the percentage of total sales for each shirt size. Of all the shirts sold, about 42.3 percent were medium, 34.6 were large, and 23.1 were small.
Percentage of Total Sales for Each Shirt Size