The NETDRAW Procedure
- Overview
- Getting Started
-
Syntax

-
DetailsNetwork Input Data SetVariables in the Network Data SetMissing ValuesLayout of the NetworkFormat of the DisplayPage FormatLayout Data SetControlling the LayoutTime-Scaled Network DiagramsZoned Network DiagramsOrganizational Charts or Tree DiagramsFull-Screen VersionGraphics VersionUsing the Annotate FacilityWeb-Enabled Network DiagramsMacro Variable _ORNETDRComputer Resource RequirementsODS Style Templates
-
ExamplesLine-Printer Network DiagramGraphics Version of PROC NETDRAWSpanning Multiple PagesThe COMPRESS and PCOMPRESS OptionsControlling the Display FormatNonstandard Precedence RelationshipsControlling the Arc-Routing AlgorithmPATTERN and SHOWSTATUS OptionsTime-Scaled Network DiagramFurther Time-Scale OptionsZoned Network DiagramSchematic DiagramsModifying Network LayoutSpecifying Node PositionsOrganizational Charts with PROC NETDRAWAnnotate Facility with PROC NETDRAWAOA Network Using the Annotate FacilityBranch and Bound TreesStatement and Option Cross-Reference Tables
- References
Example 9.18 Branch and Bound Trees
This example illustrates a nonstandard use of PROC NETDRAW. The TREE option in PROC NETDRAW is used to draw a branch and bound tree such as one that you obtain in the solution of an integer programming problem. Refer to Chapter 6: The LP Procedure in SAS/OR 12.1 User's Guide: Mathematical Programming Legacy Procedures, for a detailed discussion of branch and bound trees. The data used in this example were obtained from one particular invocation of PROC LP.
The data set NET (created in the following DATA step) contains information pertaining to the branch and bound tree. Each observation of this
data set represents a particular iteration of the integer program, which can be drawn as a node in the tree. The variable
node names the problem. The variable object gives the objective value for that problem. The variable problem identifies the parent problem corresponding to each node; for example, since the second and the seventh observations have problem equal to '-1' and '1', respectively, it indicates that the second and the seventh problems are derived from the first iteration.
Finally, the variable _pattern specifies the pattern of the nodes based on the status of the problem represented by the node.
data net;
   input node problem cond $10. object;
   if cond="ACTIVE"          then _pattern=1;
   else if cond="SUBOPTIMAL" then _pattern=2;
   else                           _pattern=3;
datalines;
 1       0     ACTIVE         4
 2      -1     ACTIVE         4
 3       2     ACTIVE         4
 4      -3     ACTIVE 4.3333333
 5       4 SUBOPTIMAL         5
 6       3   FATHOMED 4.3333333
 7       1     ACTIVE         4
 8      -7     ACTIVE         4
 9      -8   FATHOMED 4.3333333
10       8   FATHOMED 4.3333333
11       7     ACTIVE         4
12     -11   FATHOMED 4.3333333
13      11   FATHOMED       4.5
;
The next DATA step (which creates the data set LOGIC) uses this child-parent information to format the precedence relationships as expected by PROC NETDRAW. Next, the two data
sets are merged together to create the Network input data set (BBTREE) for PROC NETDRAW. The ID variable in the data set BBTREE is formatted to contain both the iteration number and the objective value.
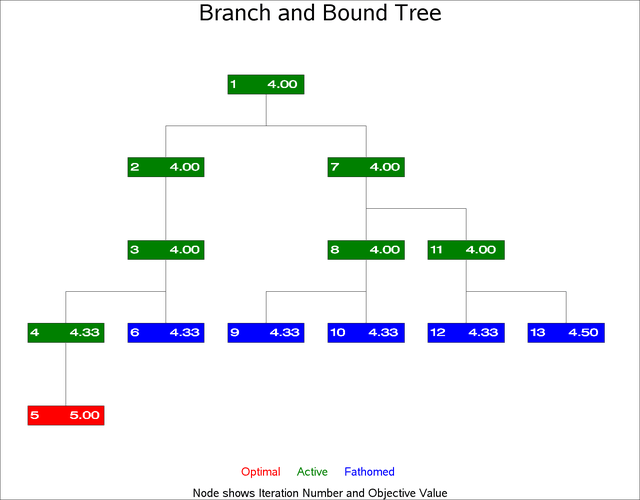
Finally, PROC NETDRAW is invoked with the TREE, ROTATE, and ROTATETEXT options to produce a branch and bound tree shown in Output 9.18.1. Note that the ROTATE and ROTATETEXT options produce a rotated graph with a top-down orientation.
/* set precedence relationships
   using child-parent information */
data logic;
   keep node succ;
   set net(firstobs=2);
   succ=node;
   node=abs(problem);
   run;
proc sort data=logic;
   by node;
   run;
/* combine the logic data and the node data */
/* set ID values                            */
data bbtree;
  length id $ 9;
  merge logic net; by node;
  if node < 10 then id=put(node,1.)||put(object,f8.2);
  else              id=put(node,2.)||put(object,f7.2);
  run;
goptions border rotate=portrait;
pattern1 v=s c=green;
pattern2 v=s c=red;
pattern3 v=s c=blue;

title h=3    j=c 'Branch and Bound Tree';
title2    ' ';
footnote1 h=1.5 j=c c=red   'Optimal  '
                    c=green '   Active  '
                    c=blue  '   Fathomed ';
footnote2 ' ';
footnote3 h=1.5 ' Node shows Iteration Number and Objective Value ';
proc netdraw data=bbtree graphics out=bbout;
   actnet /activity=node
           successor=succ
           id=(id)
           nodefid
           nolabel
           ctext=white
           coutline=black
           carcs=black
           xbetween=15
           ybetween=3
           compress
           font=swiss
           rectilinear
           tree
           rotate
           rotatetext
           arrowhead=0
           htext=2;
   run;
Output 9.18.1: Branch and Bound Tree
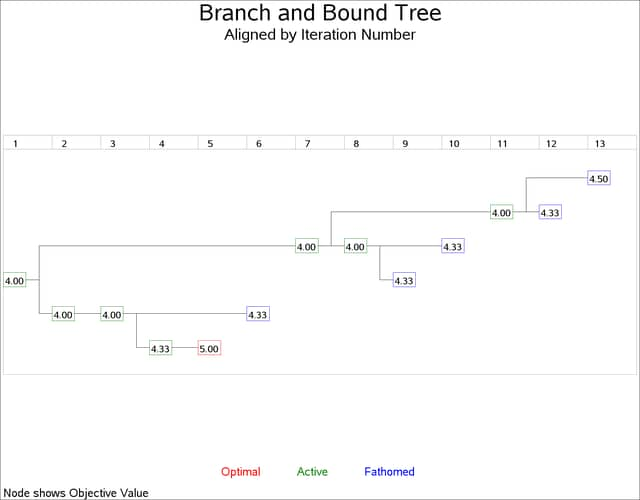
In the next invocation, PROC NETDRAW uses a modified layout of the nodes to produce a diagram where the nodes are aligned according to the iteration number. The following program uses the Layout data set produced in the previous invocation of PROC NETDRAW. The same y coordinates are used; but the x coordinates are changed to equal the iteration number. Further, the ALIGN= specification produces a time axis that labels each level of the diagram with the iteration number. Each node is labeled with the objective value. The resulting diagram is shown in Output 9.18.2.
data netin;
   set bbout;
   if _seq_ = 0; drop _seq_ ;
   _x_ = _from_;
   id = substr(id, 3);
   run;
goptions rotate=landscape;
title h=3   'Branch and Bound Tree';
title2 h=2  'Aligned by Iteration Number';
footnote1 h=1.5 j=c  c=red   'Optimal     '
                     c=green '      Active     '
                     c=blue  '      Fathomed ';
footnote2 ' ';
footnote3 j=l h=1.5 ' Node shows Objective Value ';
pattern1 v=e c=green;
pattern2 v=e c=red;
pattern3 v=e c=blue;
proc netdraw data=netin graphics;
   actnet /id=(id)
           ctext=black
           carcs=black
           align = _from_
           frame
           pcompress
           rectilinear
           arrowhead=0
           nodefid
           nolabel
           htext=2.5
           xbetween=8;
   run;
Output 9.18.2: Branch and Bound Tree: Aligned by Iteration Number