The NETDRAW Procedure
- Overview
- Getting Started
-
Syntax

-
Details
Network Input Data Set Variables in the Network Data Set Missing Values Layout of the Network Format of the Display Page Format Layout Data Set Controlling the Layout Time-Scaled Network Diagrams Zoned Network Diagrams Organizational Charts or Tree Diagrams Full-Screen Version Graphics Version Using the Annotate Facility Web-Enabled Network Diagrams Macro Variable ORNETDR Computer Resource Requirements ODS Style Definitions
-
Examples
Line-Printer Network Diagram Graphics Version of PROC NETDRAW Spanning Multiple Pages The COMPRESS and PCOMPRESS Options Controlling the Display Format Nonstandard Precedence Relationships Controlling the Arc-Routing Algorithm PATTERN and SHOWSTATUS Options Time-Scaled Network Diagram Further Time-Scale Options Zoned Network Diagram Schematic Diagrams Modifying Network Layout Specifying Node Positions Organizational Charts with PROC NETDRAW Annotate Facility with PROC NETDRAW AOA Network Using the Annotate Facility Branch and Bound Trees Statement and Option Cross-Reference Tables
- References
Example 9.17 AOA Network Using the Annotate Facility
This example illustrates the use of the Annotate Facility to draw an Activity-on-Arc network. First, PROC NETDRAW is invoked with explicit node positions for the vertices of the network. The ALIGN= and ZONE= options are used to provide horizontal and vertical axes as a frame of reference. The resulting diagram is shown in Output 9.17.1.
data widgaoa;
   format task $12. ;
   input task & days tail head _x_ _y_;
   datalines;
Approve Plan   5   1   2   1  2
Drawings      10   2   3   4  2
Study Market   5   2   4   4  2
Write Specs    5   2   3   4  2
Prototype     15   3   5   7  1
Mkt. Strat.   10   4   6  10  3
Materials     10   5   7  10  1
Facility      10   5   7  10  1
Init. Prod.   10   7   8  13  1
Evaluate      10   8   9  16  1
Test Market   15   6   9  18  2
Changes        5   9  10  20  1
Production     0  10  11  23  1
Marketing      0   6  12  19  2
Dummy          0   8   6  16  1
.              .  11   .  26  1
.              .  12   .  22  3
;
pattern1 v=e c=red;
title j=l h=3 ' Project: Widget Manufacture';
title2 j=l h=2 ' Network in Activity-on-Arc Format';
footnote j=r h=2 'Initial Layout ';

proc netdraw graphics data=widgaoa out=netout;
   actnet / act=tail
            succ=head
            id=(tail)
            align=_x_
            zone=_y_
            ybetween = 10
            nodefid
            nolabel
            pcompress
            htext=2;
   label _y_=' Y \ X ';
run;
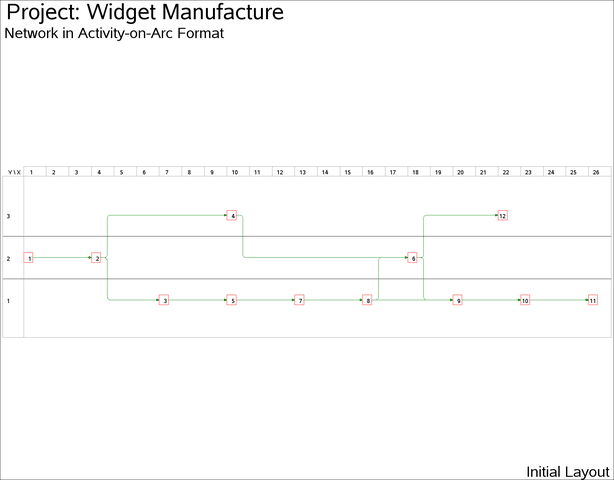
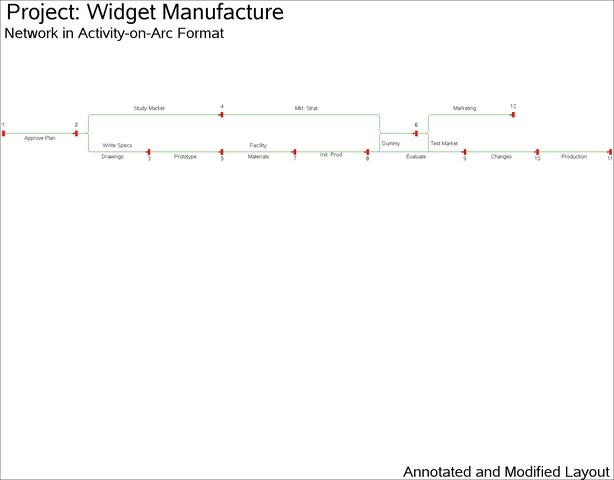
In Output 9.17.1, the arc leading from vertex '4' to vertex '6' has two turning points: (10.5, 3) and (10.5, 2). Suppose that you want the arc to be routed differently, to provide a more symmetric diagram. The next DATA step creates a data set, NETIN, which changes the  coordinates of the turning points to 16.5 instead of 10.5. Further, two Annotate data sets are created: the first one labels the nodes outside the boxes, either to the top or to the bottom, and the second one sets labels for the arcs. PROC NETDRAW is then invoked with the combined Annotate data set to produce the diagram shown in Output 9.17.2.
data netin;
  set netout;
  if _from_=4 and _to_=6 and _seq_>0 then _x_=16.5;
  run;

data anno1;
   set netout;
   if _seq_=0;
   /* Set up required variable lengths, etc. */
   length function color style   $8;
   length xsys ysys hsys         $1;
   length when position          $1;
   length TEXT                   $12;
   xsys     = '2';
   ysys     = '2';
   hsys     = '4';
   when     = 'a';
   function = 'label   ';
   size = 2;
   position = '5';
   TEXT = left(put(tail, f2.));
   x=_x_;
   if _y_ = 1 then y=_y_-.3;
   else            y=_y_+.5;
   run;
data anno2;
   /* Set up required variable lengths, etc. */
   length function color style   $8;
   length xsys ysys hsys         $1;
   length when position          $1;
   length TEXT                   $12;
   xsys     = '2';
   ysys     = '2';
   hsys     = '4';
   when     = 'a';
   function = 'label   ';
   size = 2;
   position = '5';
   x=2.5;  y=1.8;  TEXT='Approve Plan'; output;
   x=5.5;  y=.8;   TEXT='Drawings';     output;
   x=5.7;  y=1.4;  TEXT='Write Specs';  output;
   x=7;    y=3.4;  TEXT='Study Market';  output;
   x=8.5;  y=.8;   TEXT='Prototype';    output;
   x=11.5; y=1.4;  TEXT='Facility';     output;
   x=11.5; y=.8;   TEXT='Materials';    output;
   x=14.5; y=.9;   TEXT='Init. Prod';   output;
   x=13.5; y=3.4;  TEXT='Mkt. Strat.';  output;
   x=18;   y=.8;   TEXT='Evaluate';     output;
   x=21.5; y=.8;   TEXT='Changes';      output;
   x=24.5; y=.8;   TEXT='Production';   output;
   x=20;   y=3.4;  TEXT='Marketing';    output;
   position=6;
   x=16.6; y=1.5;  TEXT='Dummy';        output;
   x=18.6; y=1.5;  TEXT='Test Market';  output;
   ;

data anno;
   set anno1 anno2;
   run;
footnote j=r h=2 'Annotated and Modified Layout ';
pattern1 v=s c=red;

proc netdraw graphics data=netin anno=anno;
   actnet / nodefid
            nolabel
            boxwidth=1
            pcompress
            novcenter
            vmargin=20
            xbetween=10;
run;