The NETDRAW Procedure
- Overview
- Getting Started
-
Syntax

-
Details
Network Input Data Set Variables in the Network Data Set Missing Values Layout of the Network Format of the Display Page Format Layout Data Set Controlling the Layout Time-Scaled Network Diagrams Zoned Network Diagrams Organizational Charts or Tree Diagrams Full-Screen Version Graphics Version Using the Annotate Facility Web-Enabled Network Diagrams Macro Variable ORNETDR Computer Resource Requirements ODS Style Definitions
-
Examples
Line-Printer Network Diagram Graphics Version of PROC NETDRAW Spanning Multiple Pages The COMPRESS and PCOMPRESS Options Controlling the Display Format Nonstandard Precedence Relationships Controlling the Arc-Routing Algorithm PATTERN and SHOWSTATUS Options Time-Scaled Network Diagram Further Time-Scale Options Zoned Network Diagram Schematic Diagrams Modifying Network Layout Specifying Node Positions Organizational Charts with PROC NETDRAW Annotate Facility with PROC NETDRAW AOA Network Using the Annotate Facility Branch and Bound Trees Statement and Option Cross-Reference Tables
- References
| Layout of the Network |
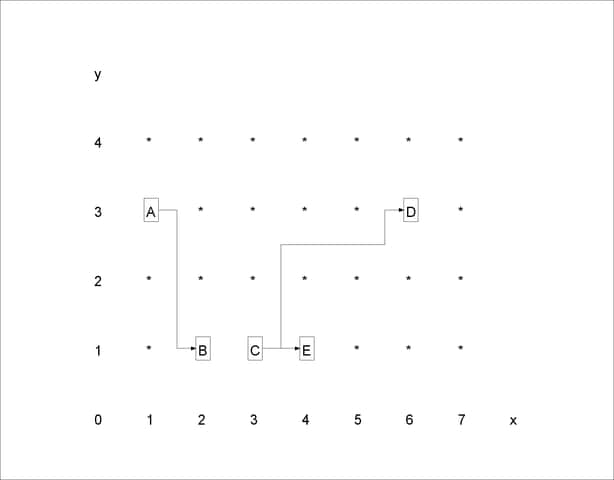
The network layout is determined in two stages. First, the precedence relationships are used to determine the positions of the nodes, which are then used to determine a routing of the arcs. The positions of the nodes and arcs are identified by specifying their  and
and  coordinates in a grid. Figure 9.7 shows a sample grid and explains some of the conventions followed by PROC NETDRAW in determining the node and arc layout. This notation will be useful in later sections that describe the Layout data set and how you can control the layout of the diagram. The asterisks in the figure represent possible positions for the nodes of the network. The arcs are routed between the possible node positions. For example, node A has coordinates
  and node B has coordinates
  . The arc connecting them has two turning points and is completely determined by the two pairs of coordinates
  and
and  ; here,
  implies that the position is midway between the coordinates
  and
and  .
.
PROC NETDRAW sets  for all nodes with no predecessors; the coordinates for the other nodes are determined so that each node is placed to the immediate right of all its predecessors; in other words, no node will appear to the left of any of its predecessors or to the right of any of its successors in the network diagram. The nodes are placed in topological order: a node is placed only after all its predecessors have been placed. Thus, the node-placement algorithm requires that there should be no cycles in the network. The coordinates of the nodes are determined by the procedure using several heuristics designed to produce a reasonable compact diagram of the network. To draw a network that has cycles, use the BREAKCYCLE option, or you can specify the node coordinates or an ALIGN= variable to circumvent the requirement of a topological ordering of the nodes (see the second part of Example 9.12).
Note that the and coordinates fix only a relative positioning of the nodes and arcs. The actual distance between two nodes, the width and height of each node, and so on can be controlled by specifying desired values for the options that control the format of the display, namely, BOXHT=, BOXWIDTH=, and so on. See the section Format of the Display for details about these options.
By default, the procedure routes the arcs using a simple heuristic that uses, at most, four turning points: the arc leaves the predecessor node from its right edge, turns up or down according to whether the successor is above or below the current node position, then tracks horizontally across to the vertical corridor just before the successor node, and then tracks in a vertical direction to meet the successor node. For example, see the tracking of the arc connecting nodes C and D in Figure 9.7.
For networks that include some nonstandard precedence constraints, the arcs may be drawn from and to the appropriate edges of the nodes, depending on the type of the constraint.
The default routing of the arcs may lead to an unbalanced diagram with too many arcs in one section and too few in another. The DP option in the ACTNET statement causes the procedure to use a dynamic programming algorithm to route the arcs. This algorithm tries to route the arcs between the nodes so that not too many arcs pass through any interval between two nodes. The procedure sets the maximum number of arcs that are allowed to be routed along any corridor to be equal to the maximum number of successors for any node. The HTRACKS= and VTRACKS=options enable you to set these maximum values: HTRACKS specifies the maximum number of arcs that are allowed to pass horizontally through any point while VTRACKS specifies the same for arcs in the vertical direction. See Example 9.7 for an illustration of the HTRACKS= option.
The layout of the network for time-scaled and zoned network diagrams is discussed in the section Time-Scaled Network Diagrams and the section Zoned Network Diagrams, respectively. the section Organizational Charts or Tree Diagrams describes the layout of the diagram when the TREE option is specified.