| The NLPC Nonlinear Optimization Solver |
Example 12.2 Maximum Likelihood Weibull Model
This model is obtained from Lawless (1982, pp. 190–194). Suppose you want to find the maximum likelihood estimates for the three-parameter Weibull model. The observed likelihood function is
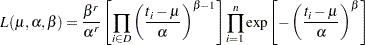 |
where  is the number of individuals involved in the experiment,
  is the set of individuals whose lifetimes are observed, and
  . Then the log-likelihood function is
 |
Note that for  , the logarithmic terms become infinite as
  . That is,
  is unbounded. Thus our interest is restricted to
  values greater than or equal to
  . Further, for the logarithmic terms to be defined, it is required that
  and
and  .
.
The following data from Pike (1966) represent the number of days it took the rats painted with the carcinogen DMBA to develop carcinomas:
230, 234, 246, 265, 304, 216*, 244*
Note that the last two observations have an asterisk next to them. This indicates that those two rats did not develop carcinomas. These are referred to as censored data.
For these data, a local maximum of occurs at  ,
,  , and
, and  . You can create the input data set by using the following SAS code:
   data pike;
      input days cens @@;
      datalines;
   143  0  164  0  188  0  188  0
   190  0  192  0  206  0  209  0
   213  0  216  0  220  0  227  0
   230  0  234  0  246  0  265  0
   304  0  216  1  244  1
   ;
The first  observations in the data set correspond to the rats that develop carcinomas;
 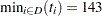 in this case. Using the preceding data, you can formulate the Weibull model as follows:
proc optmodel;
   set S;  /* set of rats in the experiment */
   set D;  /* set of rats that develop carcinomas */
   number r = card(D);
   number t{S};
   number cens{S};
   var alpha >= 0 init 1;
   var beta  >= 1 init 1;
   var mu >= 0 <= min{i in D} t[i] init 10;
   max logl = r*log(beta) - r*beta*log(alpha)
                + (beta - 1)*sum{i in D} log(t[i] - mu)
                - sum{i in S} ((t[i] - mu)/alpha)^beta;
   read data pike into S=[_n_] t=days cens;
   D = {i in S : cens[i] = 0};
   solve with nlpc / printfreq=1;
   print mu alpha beta;
quit;
Assume a starting point at  ,
,  , and
, and  . The data for all the rats in the experiment are read using the READ statement. The following statement subsets to the set of rats that develop carcinomas:
D = {i in S : cens[i] = 0};
The NLPC solver invokes the default optimization technique (the trust region method) to solve this problem.
Output 12.2.1 through Output 12.2.3 show the problem summary, iteration log, solution summary, and solution. As you can see, the solution obtained by the trust region method matches closely with the local maximum given in Lawless (1982, p. 193).
| Iteration Log: Trust Region Method | ||||
|---|---|---|---|---|
| Iter | Function Calls |
Objective Value |
Optimality Error |
Trust Region Radius |
| 0 | 0 | -3905 | 0.1874 | . |
| 1 | 1 | -2606 | 0.1357 | 1.000 |
| 2 | 2 | -1747 | 0.0990 | 1.015 |
| 3 | 3 | -1235 | 0.0754 | 0.954 |
| 4 | 4 | -959.2572 | 0.0620 | 2.060 |
| 5 | 5 | -670.6203 | 0.0472 | 1.910 |
| 6 | 6 | -520.6900 | 0.0390 | 3.942 |
| 7 | 7 | -371.3259 | 0.0305 | 3.850 |
| 8 | 8 | -292.0677 | 0.0256 | 3.987 |
| 9 | 9 | -219.7420 | 0.0214 | 7.985 |
| 10 | 10 | -179.8333 | 0.0192 | 8.222 |
| 11 | 12 | -144.7603 | 0.0196 | 18.466 |
| 12 | 13 | -125.6711 | 0.0248 | 19.148 |
| 13 | 17 | -106.4779 | 1.0000 | 11.525 |
| 14 | 21 | -88.1397 | 1.0000 | 15.904 |
| 15 | 22 | -87.4005 | 0.4041 | 15.904 |
| 16 | 23 | -87.3426 | 0.0115 | 4.288 |
| 17 | 24 | -87.3270 | 0.006032 | 4.355 |
| 18 | 25 | -87.3243 | 0.002287 | 4.355 |
| 19 | 26 | -87.3242 | 0.0000486 | 2.666 |
| 20 | 27 | -87.3242 | 1.4815E-8 | 0.359 |
| Note: | Optimality criteria (ABSOPTTOL=0.001, OPTTOL=1E-6) are satisfied. |
Copyright © SAS Institute, Inc. All Rights Reserved.