Understanding Styles
About Styles and Style Elements
ODS
styles are produced from compiled STYLE templates written in PROC
TEMPLATE style syntax. An ODS style template is a collection of style
elements that provides specific visual attributes for your SAS output.
The style elements of
a style are designed to ensure the goals of effective graphics. Each
style element is a named collection of style attributes such as color,
marker symbol, line style, font face, as well as many others. Each
graphical element of a plot, such as a marker, a bar, a line or a
title, derives its visual attributes from a specific style element
from the active style.
Changing the style for
an ODS destination is the easiest way to change a graph's appearance.
Changing the current style requires only the use of the STYLE= option
on an ODS destination statement. For more information,
see Specify a Style for an ODS Destination.
About the Default Styles
Every ODS output
destination has a default style associated with it. These default
styles are different for each destination. Therefore, your output
might look different depending on which destination you use. For example,
the default style for the PRINTER destination is “Printer”
while the default style for the RTF destination is “RTF”.
For a table that lists
the default styles for ODS destinations, see Working with Styles in SAS Output Delivery System: User's Guide.
Recommended Styles
SAS
ships a set of styles that have been designed by GUI experts to address
the needs of different situations, while ensuring the principles of
effective graphics.
The following is a
subset of the styles shipped with SAS that are particularly suited
for statistical graphics:
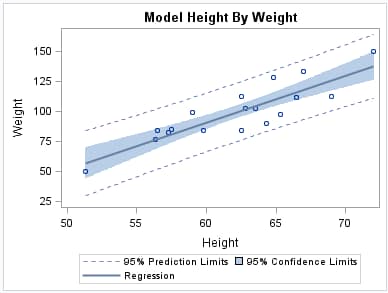
Recommended Styles
|
HTMLBLUE1
|
||
|
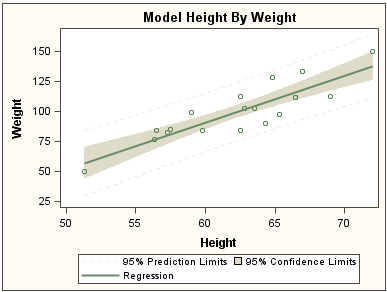
JOURNAL22
|
||
|
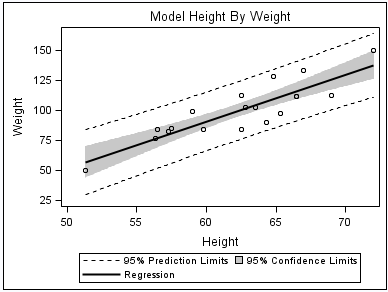
JOURNAL22
|
||
| 1HTMLBlue is the default style for the ODS HTML destination. | ||
| 2Journal2 and Journal3 by default render grouped bars with fill patterns. For more information, see Using Fill Patterns to Distinguish Grouped Bar Charts. | ||