Using Fill Patterns to Distinguish Grouped Bar Charts

Some SAS styles display fill patterns for grouped bars. Fill patterns help distinguish between different categories when you are producing or printing black and white output.
The fill patterns appear for grouped data in the following types of plots, whether generated using the SGPLOT or the SGPANEL procedure:
  • HBAR and VBAR
  • HBARPARM and VBARPARM
Here is example output that was generated using the JOURNAL2 style.
Fill Pattern for Grouped Bars
The following code was used to produce the example output.
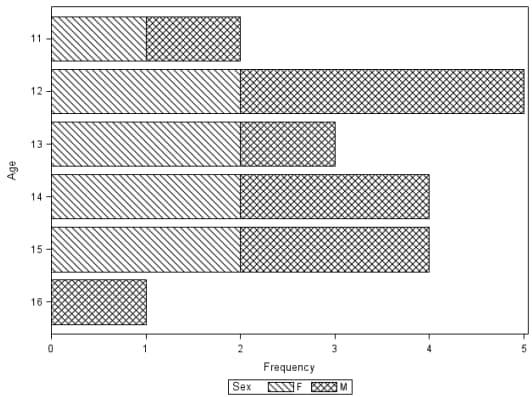
ods listing style=journal2;
proc sgplot data=sashelp.class;
hbar age / group= sex; 
run;
ods listing close;
Here are the SAS styles that by default render grouped bars with fill patterns:
  • JOURNAL2
  • JOURNAL3 (uses gray and the fill pattern)
  • MONOCHROMEPRINTER
These styles use the GRAPHBAR style element for the fill pattern. If you customize a style in the GTL, then you can add the GRAPHBAR style element to your custom style.
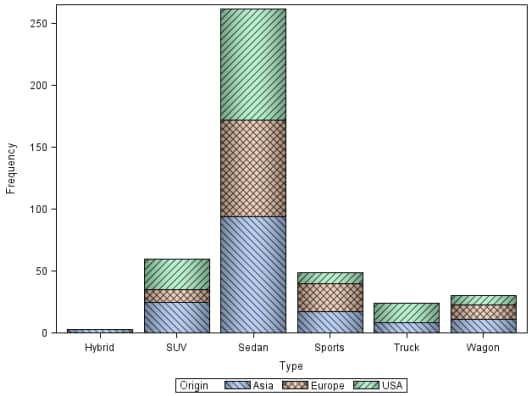
The following example shows a graph that uses a custom style. The style, based on the Journal2 style (which uses the GRAPHBAR element), adds color style elements. The result combines patterns, colors, and skins.
Fill Pattern with Color
The following code was used to produce the output.
proc template;                                                                
   define style Styles.MyJournal2;                                              
      parent = styles.journal2; 
      style GraphColors from GraphColors /
         'gdata'=cxffffff
         'gdata1'=cxffffff
         'gdata2'=cxc0c0c0
         'gdata3'=cxe0e0e0
         'gdata4'=cxa0a0a0
         'gdata5'=cx909090
         'gdata6'=cxffffff
         'gdata7'=cxc0c0c0
         'gdata8'=cxe0e0e0
         'gdata9'=cxa0a0a0
         'gdata10'=cx909090
         'gdata11'=cxffffff
         'gdata12'=cxc0c0c0
         'gdata13'=cxe0e0e0
         'gdata14'=cxa0a0a0
         'gdata15'=cx909090;
      style GraphHistogram from GraphComponent /                              
         displayopts = "outline";                                             
      style GraphEllipse from GraphComponent /                                
         displayopts = "outline";                                             
      style GraphBand from GraphComponent /                                   
         displayopts = "outline";                                             
      style GraphBox from GraphComponent /                                    
         displayopts = "caps median mean outliers"                            
         connect = "mean"                                                     
         capstyle = "serif";                                                  
      style GraphBar from GraphComponent /                                    
         displayopts = "outline fillpattern";                                 
      style GraphData1 from GraphData1 /                                      
         fillpattern = "L1";                                                  
      style GraphData2 from GraphData2 /                                      
         fillpattern = "X1";                                                  
      style GraphData3 from GraphData3 /                                      
         fillpattern = "R1";                                                  
      style GraphData4 from GraphData4 /                                      
         fillpattern = "L2";                                                  
      style GraphData5 from GraphData5 /                                      
         fillpattern = "X2";                                                  
      style GraphData6 from GraphData6 /                                      
         fillpattern = "R2";                                                  
      style GraphData7 from GraphData7 /                                      
         fillpattern = "L3";                                                  
      style GraphData8 from GraphData8 /                                      
         fillpattern = "X3";                                                  
      style GraphData9 from GraphData9 /                                      
         fillpattern = "R3";                                                  
      style GraphData10 from GraphData10 /                                    
         fillpattern = "L4";                                                  
      style GraphData11 from GraphData11 /                                    
         fillpattern = "X4";                                                  
      style GraphData12 from GraphData12 /                                    
         fillpattern = "R4";                                                  
      style GraphData13 from GraphComponent /                                 
         fillpattern = "L5";                                                  
      style GraphData14 from GraphComponent /                                 
         fillpattern = "X5";                                                  
      style GraphData15 from GraphComponent /                                 
         fillpattern = "R5";         
  end;                                                                       

  define style Styles.MyJournal3;                                              
      parent = styles.MyJournal2;
      style GraphBar from GraphComponent /                                    
         displayopts = "fill outline fillpattern";                                 
      style GraphColors from GraphColors /
         'gdata'=cxffffff
         'gdata1'=cxa0c0f0
         'gdata2'=cxf0c0a0
         'gdata3'=cxa0f0c0;
  end;
run;
ods listing style=MyJournal3;
ods graphics / reset imagename='MyBarPatterns';
proc sgplot data=sashelp.cars;
vbar type / group= origin dataskin= pressed;
run;
ods listing close;