Example Program and Statement Details
Example Program
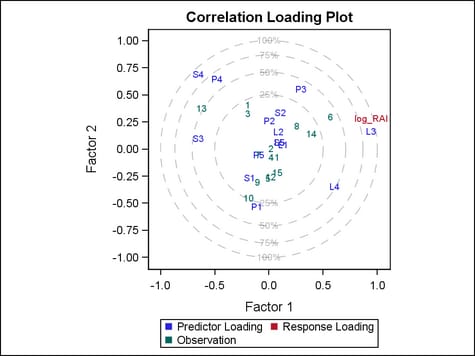
This is a simplified
version of the CorrLoadPlot template for PROC PLS in the SAS/STAT
product. It consists of overlaid scatter plots of the scores of the
first two factors, the loadings of the model effects, and the loadings
of the dependent variables. The loadings are scaled so that the amount
of variation in the variables that is explained by the model is proportional
to the distance from the origin; circles indicating various levels
of explained variation are also overlaid.
The circles are drawn
with ELLIPSEPARM statements by setting the SEMIMAJOR and SEMIMINOR
lengths to be the same. Notice that all circles are concentric because
they share the same origin (0,0). The radius of each circle is passed
dynamically.
Also note that an OVERLAYEQUATED
layout was used to force the length of unit intervals on both axes
to be the same.
The input data shown
is representative of that computed by PROC PLS for the Correlation
Loadings Plot. For more details, see the first example for PROC PLS
in the SAS/STAT user’s guide.
proc template;
 define statgraph ellipseparm;
  dynamic RADIUS1 RADIUS2 RADIUS3 RADIUS4 ;
  begingraph;
   entrytitle "Correlation Loading Plot";
   layout overlayequated / equatetype=square
     commonaxisopts=
      (tickvaluelist=(-1 -.75 -.5 -.25 0 .25 .5 .75 1)
        viewmin=-1 viewmax=1)
     xaxisopts=
      (label="Factor 1" offsetmin=0.05 offsetmax=0.05)
     yaxisopts=
      (label="Factor 2" offsetmin=0.05 offsetmax=0.05);
    ellipseparm semimajor=RADIUS1 semiminor=RADIUS1 slope=0
     xorigin=0 yorigin=0 / clip=true display=(outline)
     outlineattrs=(pattern=dash) datatransparency=.75;
    ellipseparm semimajor=RADIUS2 semiminor=RADIUS2 slope=0
     xorigin=0 yorigin=0 / clip=true display=(outline)
     outlineattrs=(pattern=dash) datatransparency=.75;
    ellipseparm semimajor=RADIUS3 semiminor=RADIUS3 slope=0
     xorigin=0 yorigin=0 / clip=true display=(outline)
     outlineattrs=(pattern=dash) datatransparency=.75;
    ellipseparm semimajor=RADIUS4 semiminor=RADIUS4 slope=0
     xorigin=0 yorigin=0 / clip=true display=(outline)
     outlineattrs=(pattern=dash) datatransparency=.75;

    scatterplot x=xcirclelabel y=ycirclelabel / primary=true
     markercharacter=circlelabel datatransparency=0.75 ;
    scatterplot x=corr1 y=corr2 / name="ScatterVars"
     group=corrgroup markercharacter=corrlabel;
    discretelegend "ScatterVars";
   endlayout;
  endGraph;
 end;
run;

data corrplot;
  infile cards missover;
  input Corr1 Corr2 CorrGroup &$18. CorrLabel :$7.
        xCircleLabel  yCircleLabel CircleLabel :$8.;
datalines;
-0.179 -0.268 Predictor Loading  S1 0  0.5 25%
 0.105  0.332 Predictor Loading  S2 0 -0.5 25%
-0.654  0.094 Predictor Loading  S3 0  0.707 50%
-0.653  0.685 Predictor Loading  S4 0 -0.707 50%
 0.096  0.059 Predictor Loading  S5 0  0.866 75%
 0.132  0.036 Predictor Loading  L1 0 -0.866 75%
 0.087  0.156 Predictor Loading  L2 0  1 100%
 0.940  0.160 Predictor Loading  L3 0 -1 100%
 0.607 -0.350 Predictor Loading  L4
 0.096  0.059 Predictor Loading  L5
-0.111 -0.534 Predictor Loading  P1
 0.003  0.256 Predictor Loading  P2
 0.293  0.551 Predictor Loading  P3
-0.480  0.643 Predictor Loading  P4
-0.096 -0.059 Predictor Loading  P5
 0.946  0.279 Response Loading  log_RAI
-0.196  0.403 Observation  1
 0.020 -0.001 Observation  2
-0.195  0.324 Observation  3
 0.021 -0.079 Observation  4
-0.009 -0.274 Observation  5
 0.567  0.294 Observation  6
-0.096 -0.059 Observation  7
 0.258  0.210 Observation  8
-0.104 -0.309 Observation  9
-0.187 -0.458 Observation  10
 0.051 -0.078 Observation  11
 0.017 -0.260 Observation  12
-0.621  0.372 Observation  13
 0.392  0.138 Observation  14
 0.080 -0.221 Observation  15
run;

proc sgrender data=corrplot template=ellipseparm;
  dynamic radius1=.50 radius2=.71 radius3=.87 radius4=1;
run;
Statement Summary
The ELLIPSEPARM statement
plots an ellipse with specified semimajor and semiminor axis lengths,
a specified slope for the major axis, and the ellipse center. The
ellipse center is the point of intersection of the semimajor and semiminor
axes.
An ELLIPSEPARM plot
does not perform computations on input data to derive the location
and shape of the ellipse. See ELLIPSE Statement for information about computed ellipses.
An ELLIPSEPARM statement
can be used only within a two-dimensional overlay-type layout (for
example, an OVERLAY, OVERLAYEQUATED, or PROTOTYPE layout). Another
plot that is derived from data values that provide boundaries for
the axis area must be included in the layout. It is typically overlaid
with a scatter plot.
You can generate a single
ellipse by specifying a constant for each required argument. You can
generate multiple ellipses by specifying a numeric column for any
or all required arguments. If any of the SEMIMAJOR=, SEMIMINOR=, XORIGIN= or YORIGIN= constants or columns contains a missing
value, no ellipse is drawn. To request a vertical major axis, specify
SLOPE=. (missing
value as a constant or column value).
If the GROUP= option is specified, then the group value must be a column
(character or numeric). For each group value, there must be a numeric
column value that does not contain missing values for SEMIMAJOR=, SEMIMINOR=, XORIGIN=, and YORIGIN=. The SLOPE= column might contain missing values. Under these circumstances,
one or more ellipse might be drawn for each group value.
Required Arguments
specifies the X coordinate
of the center of the ellipse.
By default, if the
value specified for the XORIGIN= option is outside of the X-axis data
range, then the data range is extended to include the specified point.
This behavior can be changed with the CLIP= option.
specifies the Y coordinate
of the center of the ellipse.
By default, if the
value specified for the YORIGIN= option is outside of the Y-axis data
range, then the data range is extended to include the specified point.
This behavior can be changed with the CLIP= option.
Options
specifies the degree
of the transparency of the ellipse fill color and outline.
Tip: The FILLATTRS= option can be used to set transparency
for just the ellipse fill. You can combine this option with FILLATTRS=
to set one transparency for the ellipse outline but a different transparency
for the ellipse fill. Example:
datatransparency=0.2 fillattrs=(transparency=0.6)
specifies whether to
display an outlined ellipse, a filled ellipse, or an outlined and
filled ellipse.
specifies the appearance
of the interior fill area of the ellipse. See General Syntax for Attribute Options for the syntax
on using a style-element and Fill Options for available fill-options.
Interaction: For
this option to have any effect, the fill must be enabled by the ODS
style or the DISPLAY= option.
Tip: The DATATRANSPARENCY option sets the transparency for
the ellipse fill and ellipse outline. You can combine this option
with DATATRANSPARENCY= to set one transparency for the outline but
a different transparency for the fill. Example:
datatransparency=0.2 fillattrs=(transparency=0.6)
creates a separate
ellipse for each unique group value of the specified column.
specifies
a discrete attribute variable that is defined in a DISCRETEATTRVAR statement.
-
If DISPLAY=(OUTLINE), each distinct group value might be represented in the graph by a different combination of outline color and line pattern. Line color and pattern vary according to the ContrastColor and LineStyle attributes of the GraphData1–GraphDataN style elements. Line thickness (for grouped and ungrouped data) is controlled by the OUTLINEATTRS= option.
Restriction: This
option can be used only when a numeric column is specified for the SLOPE=, SEMIMAJOR=, and SEMIMINOR= arguments.
Interaction: The
INCLUDEMISSINGGROUP option controls whether missing group values are
considered a distinct group value.
Tip:
The representations that are used to identify the groups can be overridden
individually. For example, each distinct group value might be represented
by a different line pattern for the ellipses, but the PATTERN= suboption
of the OUTLINEATTRS= option could be used to assign the
same line pattern to all ellipse outlines, letting outline color distinguish
group values.
specifies whether missing
values of the group variable are included in the plot.
Tip:
Unless a discrete attribute map is in effect or the INDEX= option
is used, the attributes of the missing group value are determined
by the GraphMissing style element except when the MISSING= system
option is used to specify a non-default missing character or when
a user-defined format is applied to the missing group value. In those
cases, the attributes of the missing group value are determined by
a GraphData1–GraphDataN style element.
specifies indices for
mapping line attributes (color and pattern) and fill attributes to
one of the GraphData1–GraphDataN style elements.
Restriction: If
the value of the numeric-column is
missing or is less than 1, the observation is not used in the analysis.
If the value is not an integer, only the integer portion is used.
Interaction: All
of the indexes for a specific group value must be the same. Otherwise,
the results are unpredictable.
Interaction: The
index values are 1-based indices. For the style elements in GraphData1–GraphDataN,
if the index value is greater than N, then a modulo operation remaps
that index value to a number less than N to determine which style
element to use.
Discussion: Indexing
can be used to collapse the number of groups that are represented
in a graph. For more information, see Remapping Groups for Grouped Data.
specifies the attributes
of the ellipse outline. See General Syntax for Attribute Options for the syntax
on using a style-element and Line Options for available line-options.
specifies whether data
are mapped to the primary X (bottom) axis or to the secondary X2 (top)
axis.
Interaction: The
overall plot specification and the layout type determine the axis
display. For more information, see How Axis Features Are Determined.
specifies whether data
are mapped to the primary Y (left) axis or to the secondary Y2 (right)
axis.
Interaction: The
overall plot specification and the layout type determine the axis
display. For more information, see How Axis Features Are Determined.