Example Program and Statement Details
Example Program
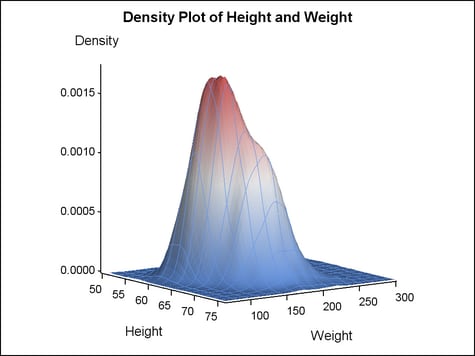
proc template;
  define statgraph layoutoverlay3d;
    begingraph;
      entrytitle "Density Plot of Height and Weight";
      layout overlay3d / tilt=10  rotate=54
                         walldisplay=none cube=false;
        surfaceplotparm x=height y=weight z=density /
          surfacecolorgradient=density;
      endlayout;
    endgraph;
  end;
run;
proc sgrender data=sashelp.gridded template=layoutoverlay3d;
run;
Statement Summary
The LAYOUT OVERLAY3D
statement builds a 3-D composite using one or more GTL-statements. You can specify one or more 3-D
plots within the layout, provided all plots can share the same type
of axes. You can also specify “annotations” (for example,
with one or more ENTRY statements or LAYOUT GRIDDED statements). However,
annotations in the OVERLAY3D layout are more likely to collide with
other graphics features than are annotations in other overlay-type
layouts.
As an overlay-type layout,
OVERLAY3D has the same behavioral characteristics as an OVERLAY layout.
It uses the same general logic for rendering the composite (see LAYOUT OVERLAY Statement for details), and its default axis
characteristics are generally determined by the first specified plot,
unless you use PRIMARY=TRUE on another plot statement (see When Plots Share Data and a Common Axis).
Within an OVERLAY3D
layout, a graph’s bounding cube can be tilted, rotated, and
zoomed to provide a different viewpoint. By default, the outline of
the bounding cube is displayed and the viewing rotation angle is 57
degrees, the tilt angle is 20 degrees, and the zoom factor is 1. See
the CUBE=, ROTATE=, TILT=, and ZOOM= options for information about how
to change the viewpoint.
Options
specifies the attributes
of the border line around the layout. See General Syntax for Attribute Options for the syntax
on using a style-element and Line Options for available line-options.
specifies whether the
visual attributes of lines and fills in nested plot statements automatically
change from plot to plot. See Cycling through Group Attributes in Overlaid Plots for more information.
does not cycle the
default visual attributes of multiple plots. For example, if you overlay
two surface plots, each surface has the same visual properties.
the system looks at
the plots in the layout and tries to use the GraphData1 - GraphDataN
style elements to assign different visual properties to the plots.
For example, if you overlay two surface plots, the two surfaces receive
different visual properties. These default properties are determined
by the next GraphDataN style element not already used.
specifies the amount
of extra space that is added inside the layout border.
Default: The default padding for all sides is 0. Values without units are
in pixels (px). A unit must be provided if other than pixels.
Enables separate settings
for the left, right, top, and bottom padding dimensions. Use the pad-options to create non-uniform padding. These
options must be enclosed in parentheses. Each option is specified
as a name = value pair. Sides
not assigned padding are padded with the default amount.
| LEFT=dimension | specifies the amount of extra space added to the left side. |
| RIGHT=dimension | specifies the amount of extra space added to the right side. |
| TOP=dimension | specifies the amount of extra space added to the top. |
| BOTTOM=dimension | specifies the amount of extra space added to the bottom. |
specifies whether the
plot’s walls and wall outlines are displayed.
Use the WALLCOLOR= option to control the color of the
wall.
Also see the CUBE= option.
specifies one or more
X axis options. For a list of options, see Axis Options for LAYOUT OVERLAY3D.
specifies one or more
Y axis options. For a list of options, see Axis Options for LAYOUT OVERLAY3D.
specifies one or more
Z axis options. For a list of options, see Axis Options for LAYOUT OVERLAY3D.