Example Program and Statement Details
Example Program
data bubbleintro;
input Engineer $ Salary number;
format Salary dollar7.0 number comma6.0;
datalines;
Electric 59000 89382
Civil 54000 73273
Software 56000 34833
Chemical 62000 25541
Mechanical 60000 19601
;
proc template;
define statgraph engineer;
begingraph;
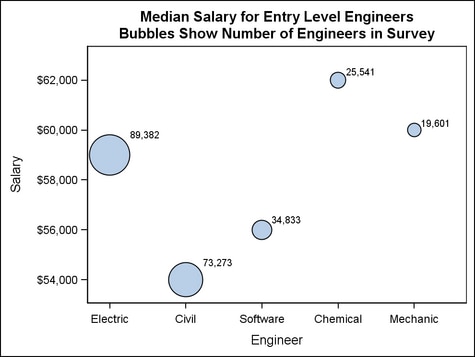
entrytitle 'Median Salary for Entry Level Engineers';
entrytitle 'Bubbles Show Number of Engineers in Survey';
layout overlay;
bubbleplot x=engineer y=salary
size=number / datalabel=number;
endlayout;
endgraph;
end;
proc sgrender data=bubbleintro template=engineer;
run;Statement Summary
The BUBBLEPLOT statement
displays one bubble for each row in the data, provided that row contains
nonmissing values for X, Y, and SIZE. By default, the bubbles are
displayed as filled, outlined circles. Regardless of the data order,
the bubbles are always drawn from the largest size to the smallest
size.
By default, the minimum
and maximum values of the SIZE= column establish a range over which
the bubble radii increase in linear proportion. The actual drawing
size of the smallest and largest bubble is set automatically. You
can adjust the smallest and largest bubble sizes with the BUBBLERADIUSMIN= and BUBBLERADIUSMAX= options. In these cases where the
bubble sizes are proportional to each other, the default setting RELATIVESCALE=TRUE
is appropriate.
If the SIZE= values
are in the same units as the X and Y values, and both X and Y are
numeric, you can generate a plot where the bubble-radius units match
the axis-scale units. To do so, specify the BUBBLEPLOT statement within
a LAYOUT OVERLAYEQUATED block, and in the BUBBLEPLOT statement, set
RELATIVESCALE=FALSE.
Note: Within a LAYOUT OVERLAY,
the unit-interval of the X and Y axes are not necessarily the same
and the bubbles might be distorted into ellipses when RELATIVESCALE=FALSE.
The OVERLAYEQUATED container ensures that the bubbles are displayed
as circles, assuming that both the X= and Y= arguments specify numeric
columns.
data influence;
input x y radius category;
datalines;
2  4 1 1
5  5 2 1
6  3 2 2
12 7 3 2
;
proc template;
  define statgraph equatedbubbles;
    begingraph;
      entrytitle 'Radius of Influence';
      entrytitle 'Bubbles Show Distance Covered by Observation';
      layout overlayequated /
          xaxisopts = (griddisplay=on)
          yaxisopts = (griddisplay=on);
        bubbleplot x=x y=y size=radius /
          group=category datatransparency=0.5
          relativescale=false ;
      endlayout;
    endgraph;
  end;

proc sgrender data=influence template=equatedbubbles;
run;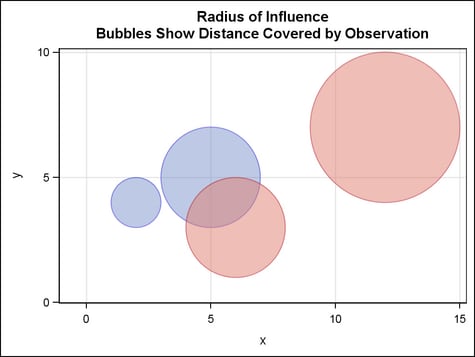
Options
specifies a style element
to be used with the COLORRESPONSE= option.
Default: The
ThreeColorRamp style element for filled bubbles and ThreeColorAltRamp
for unfilled bubbles.
name of a style element.
The style element should contain these style attributes:
| STARTCOLOR | color for the smallest data value of the RESPONSECOLOR= variable |
| NEUTRALCOLOR | color for the midpoint of the range of the REPONSECOLOR variable |
| ENDCOLOR | color for the highest data value of the RESPONSECOLOR variable |
Tip: To
reverse the start and end colors of the ramp that is assigned to the
color model, use the REVERSECOLORMODEL= option.
specifies a column
that is used to map bubble colors to a continuous gradient. The gradient
represents the range of unique response values.
specifies
a range attribute variable that is defined in a RANGEATTRVAR statement.
-
If a numeric-column or an expression is specified, the color ramp that is specified by the COLORMODEL= option.
Interaction: If DISPLAY=(FILL OUTLINE), the bubble fill colors are assigned according
to the gradient, but the bubble outlines are fixed according to the OUTLINEATTRS= settings.
specifies the color
and font attributes of the bubble labels. See General Syntax for Attribute Options for the syntax
on using a style-element and Text Options for available text-options.
enhances the visual
appearance of the filled bubbles.
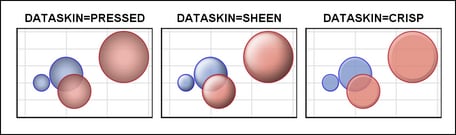
Requirement:
For this option to have any effect, DISPLAY=FILL must be in effect. Otherwise, this option is ignored.
Interaction: When
a data skin is applied, all bubble outlines are set by the skin, and
the OUTLINEATTRS= option is ignored.
specifies the degree
of the transparency of the bubble fills and bubble outlines.
Tip: The FILLATTRS= option can be used to set transparency
for just the filled bubble areas. You can combine this option with
FILLATTRS= to set one transparency for the bubble outlines but a different
transparency for the bubble fills. Example:
datatransparency=0.2 fillattrs=(transparency=0.6)
specifies whether to
display outlined bubbles, filled bubbles, or outlined and filled bubbles.
Tip: Use
the DATASKIN=, OUTLINEATTRS=, and FILLATTRS= options to control the appearance
of the bubbles.
specifies the appearance
of the filled bubble areas. See General Syntax for Attribute Options for the syntax
on using a style-element and Fill Options for available fill-options.
Interaction: For
this option to have any effect, the fill must be enabled by the ODS
style or the DISPLAY= option.
Interaction: When COLORRESPONSE= is
in effect and the DISPLAY= option
enables FILL display, the FILLATTRS= suboption COLOR= is ignored,
and the bubble fill colors vary according to the gradient.
Tip: The DATATRANSPARENCY= option sets the transparency for
the bubble fills and the bubble outlines. You can combine this option
with DATATRANSPARENCY= to set one transparency for the outlines but
a different transparency for the fills. Example:
datatransparency=0.2 fillattrs=(transparency=0.6)
creates a separate
bubble color for each unique grouping that is specified.
specifies
a discrete attribute variable that is defined in a DISCRETEATTRVAR statement.
Default: No
default. All bubbles have only one fill and one outline color as specified
by the FILLATTRS= and OUTLINEATTRS options.
Interaction: When
this option is used, the unique column values are found and then the
bubble colors are taken from the following sources:
-
If a column or an expression is specified, the bubble attributes are derived from the GraphData1–GraphDataN style elements. If the bubbles are filled, then the COLOR attribute is used for bubble fill and the CONTRASTCOLOR attribute is used for the bubble outlines. If the bubbles are not filled, then the CONTRASTCOLOR and PATTERN are used for the bubble outlines.
Interaction: The
mapped color that is used for outlines is also used as the color of
the data labels.
specifies whether missing
values of the group variable are included in the plot.
Tip:
Unless a discrete attribute map is in effect or the INDEX= option
is used, the attributes of the missing group value are determined
by the GraphMissing style element except when the MISSING= system
option is used to specify a non-default missing character or when
a user-defined format is applied to the missing group value. In those
cases, the attributes of the missing group value are determined by
a GraphData1–GraphDataN style element.
specifies indices for
mapping bubble color and line attributes to one of the GraphData1–GraphDataN
style elements.
Restriction: If
the value of the numeric-column is
missing or is less than 1, the observation is not used in the analysis.
If the value is not an integer, only the integer portion is used.
Interaction: All
of the indexes for a specific group value must be the same. Otherwise,
the results are unpredictable.
Interaction: The
index values are 1-based indices. For the style definitions in GraphData1–GraphDataN,
if the index value is greater than N, then a modulo operation remaps
that index value to a number less than N to determine which style
to use.
Discussion: Indexing
can be used to collapse the number of groups that are represented
in a graph. For more information, see Remapping Groups for Grouped Data.
specifies the appearance
of the bubble outlines. See General Syntax for Attribute Options for the syntax
on using a style-element and Line Options for available line-options.
-
For grouped data, unfilled bubbles use both the CONTRASTCOLOR and PATTERN attributes of the GraphData1–GraphDataN style elements. Filled bubbles use only the CONTRASTCOLOR attribute.If the COLORRESPONSE= option is specified and the bubbles are filled, then the outline attributes are derived from the GraphDataDefault style element. For unfilled bubbles, the outline colors vary according to the gradient.
Interaction: For
this option to have any effect, outlines must be enabled by the ODS
style or the DISPLAY= option.
Interaction: When
the COLORRESPONSE= and DISPLAY=(OUTLINE) options
are in effect, the OUTLINEATTRS= suboption COLOR= is ignored, and
the bubble outline colors vary according to the gradient.
specifies that the
data columns for this plot and the plot type be used for determining
default axis features.
Details: This
option is needed only when two or more plots within an overlay-type
layout contribute to a common axis. For more information, see When Plots Share Data and a Common Axis
specifies
whether the SIZE= column values are interpreted as relative values.
Interaction: When
this option is set to TRUE, the BUBBLERADIUSMAX= and BUBBLERADIUSMIN= options can be used to fix the drawing
size of the smallest bubble and largest bubble. If RELATIVESCALE=FALSE,
the BUBBLERADIUSMAX= and BUBBLERADIUSMIN= options are ignored.
Interaction: If
either the X= argument or the Y= argument specifies categorical values,
RELATIVESCALE=FALSE is ignored.
Details: Relative
means that the size values do not translate directly into bubble radii.
Rather, the bubble sizes are scaled to represent the value range of
the SIZE= column.
For example, when RELATIVESCALE=TRUE,
if only two bubbles are drawn with sizes of 2 and 4 they would appear
the same as only two bubbles with sizes of 4000 and 8000. By contrast,
when RELATIVESCALE=FALSE, the size values are interpreted in the
same units as the axes.
If you set this option
to FALSE, it is recommended that you also place the BUBBLEPLOT statement
in a LAYOUT OVERLAYEQUATED container. This ensures that the X and
Y axis units are the same. For more information, see Statement Summary.
specifies
the type of scaling that is to be applied to the SIZE= column
values.
Note: This feature is
for the second maintenance release of SAS 9.3 and later. See What's New in the SAS 9.3 Graph Template Language.
The
size of the bubbles increases in linear proportion to the range of
the SIZE= column values. For example, if only
two bubbles are drawn with sizes of 2 and 4, they appear the same
as only two bubbles with sizes of 4000 and 8000.
The
size of each bubble is directly proportional to its corresponding
SIZE= column
value. For example, if only two bubbles are
drawn with sizes of 50 and 100, the bubble for SIZE=50 is drawn to
half the size of the bubble for SIZE=100.
Interaction: When
the SIZETHRESHOLDMAX= option is specified, for
any SIZE= column value that is greater than the SIZETHRESHOLDMAX=
value, the proportional scale is adjusted so that the size of the
bubble for that value is clamped to the BUBBLERADIUSMAX= value.
Interaction: If
all the values for the SIZE= column are negative, RELATIVESCALETYPE=PROPORTIONAL is
ignored, and the default value is used.
Interaction: When
RELATIVESCALETYPE=PROPORTIONAL is specified, the BUBBLERADIUSMIN= option
specifies the minimum bubble size. In
that case, when a SIZE= column value results in a bubble of a size that is less
than the BUBBLERADIUSMIN= value, the bubble size for that value is
changed to the BUBBLERADIUSMIN= value.
specifies whether to
reverse the gradient (color ramp) that is defined by either the ODS
style that is in effect or by the COLORMODEL= option.
specifies user-defined
roles that can be used to display information in the tooltips. Columns
for the tooltip display are specified in the TIP= option.
specifies
a SIZE= column
value threshold at which bubble size is clamped to the BUBBLERADIUSMAX= option value. The size of the bubbles
for all SIZE= column values that equal or exceed the specified threshold
value is set to the BUBBLERADIUSMAX= value.
Note: This feature is
for the second maintenance release of SAS 9.3 and later. See What's New in the SAS 9.3 Graph Template Language.
specifies the information
to display when the cursor is positioned over the bubbles. If this
option is used, it replaces all the information displayed by default.
Roles for columns that do not contribute to the bubble plot can be
specified along with roles that do.
Default: The
columns assigned to these roles are automatically included in the
tooltip information: X, Y , SIZE, GROUP, DATALABEL, and COLORRESPONSE.
an ordered, blank-separated
list of unique BUBBLEPLOT and user-defined roles. BUBBLEPLOT roles
include X, Y, SIZE, GROUP, DATALABEL, and COLORRESPONSE.
User-defined roles
are defined with the ROLENAME= option.
Requirement: To
generate tooltips, you must include an ODS GRAPHICS ON statement that
has the IMAGEMAP option specified, and write the graphs to the ODS
HTML destination.
The labels and formats
for the TIP variables can be controlled with theTIPLABEL= and TIPFORMAT= options.
specifies display formats
for information defined by the tooltip roles. Only the roles that
appear in the TIP= option are used.
Default: The
column format of the variable assigned to the role or BEST6. if no
format is assigned to a numeric column.
Requirement: Columns
must be assigned to the roles for this option to have any effect.
See the ROLENAME= option.
specifies whether data
are mapped to the primary X (bottom) axis or to the secondary X2 (top)
axis.
Interaction: The
overall plot specification and the layout type determine the axis
display for the specified axis. For more information, see How Axis Features Are Determined.
specifies whether data
are mapped to the primary Y (left) axis or to the secondary Y2 (right)
axis.
Interaction: The
overall plot specification and the layout type determine the axis
display for the specified axis. For more information, see How Axis Features Are Determined.