Example Program and Statement Details
Example Program
data CarPref;
input Make $12. Model $13. (S1-S25) (1.);
datalines;
Cadillac Deville 8007990491240508971093809
Chevrolet Aveo 0051200423451043003515698
Chevrolet Cavalier 4053305814161643544747795
Chevrolet Malibu 6027400723121345545668658
Dodge Intrepid 7006000434101107333458708
Dodge Stratus 3005005635461302444675655
Dodge Neon 4005003614021602754476555
Ford Taurus 2024006715021443530648655
Ford Mustang 5007197705021101850657555
Ford Focus 0021000303030201500514078
Honda Accord 5956897609699952998975078
Honda Civic 4836709507488852567765075
Lincoln LS 7008990592230409962091909
Pontiac Firebird 0107895613201206958265907
Volkswagen Jetta 4858696508877795377895000
Volkswagen Beetle 4858509709695795487885000
Volvo S40 9989998909999987989919000
;
run;
* Compute Two Component Model;
ods graphics;
ods exclude all;
ods output mdprefplot=plotdata;
proc prinqual data=CarPref n=2 replace mdpref method=mgv;
id model;
transform monotone(S1-S25);
run;
ods select all;
proc template;
define statgraph vectorplot;
begingraph;
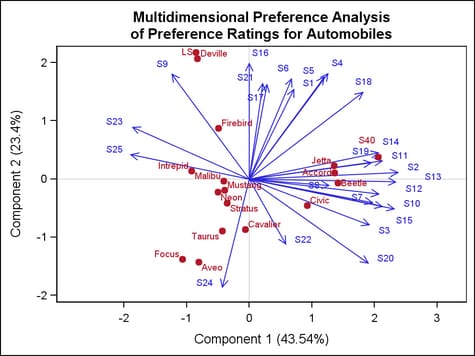
entrytitle "Multidimensional Preference Analysis";
entrytitle "of Preference Ratings for Automobiles";
layout overlayequated / equatetype=fit cycleattrs=true;
referenceline y=0 / datatransparency=.7;
referenceline x=0 / datatransparency=.7;
vectorplot y=vec2 x=vec1 xorigin=0 yorigin=0 /
datalabel=label2var;
scatterplot y=prin2 x=prin1 /
datalabel=idlab1 primary=true
markerattrs=(symbol=circlefilled);
endlayout;
endgraph;
end;
run;
proc sgrender data=plotdata template=vectorplot;
run;
Options
specifies the placement
of the arrowhead(s) at the end of the vector.
specifies a single
arrowhead, pointing away from the origin, at the end of the vector
away from the origin.
Use the ARROWHEADSHAPE= option to control arrowhead appearance.
specifies whether arrowheads
are displayed on the vectors.
Interaction: When
this option is set to FALSE, the ARROWDIRECTION= and ARROWHEADSHAPE= options are ignored and all vectors
are displayed as undirected line segments.
specifies the shape
of the arrowheads.
Use the ARROWDIRECTION= option to control arrow direction.
specifies the color
and font attributes of the data labels. See General Syntax for Attribute Options for the syntax
on using a style-element and Text Options for available text-options.
creates a distinct
set of vector lines and data label colors for each unique group value
of the specified column.
specifies
a discrete attribute variable that is defined in a DISCRETEATTRVAR statement.
Default: Each
distinct group value might be represented in the graph by a different
combination of color and line pattern. Lines vary according to the
ContrastColor and LineStyle attributes of the GraphData1–GraphDataN
style elements.
Interaction: The
group values are mapped in the order of the data, unless the INDEX= option is used to alter the default sequence of line patterns
and colors.
Interaction: The INCLUDEMISSINGGROUP= option controls whether missing group
values are considered a distinct group value.
Tip:
The LINEATTRS= option can be used to override the
representations that are used to identify the groups. For example,
LINEATTRS=(PATTERN=SOLID) can be used to assign the same pattern to
all of the lines, letting the line color distinguish group values.
Likewise, LINEATTRS=(COLOR=BLACK) can be used to assign the same color
to all of the lines, letting the line pattern distinguish group values.
specifies whether missing
values of the group variable are included in the plot.
Tip: Unless
a discrete attribute map is in effect or the INDEX= option is used,
the attributes of the missing group value are determined by the GraphMissing
style element except when the MISSING= system option is used to specify
a non-default missing character or when a user-defined format is applied
to the missing group value. In those cases, the attributes of the
missing group value are determined by a GraphData1–GraphDataN
style element.
specifies indices for
mapping line attributes (color and pattern) to one of the GraphData1–GraphDataN
style elements.
Restriction: If
the value of the numeric-column is
missing or is less than 1, the observation is not used in the analysis.
If the value is not an integer, only the integer portion is used.
Interaction: All
of the indexes for a specific group value must be the same. Otherwise,
the results are unpredictable.
Interaction: The
index values are 1-based indices. For the style elements GraphData1–GraphDataN,
if the index value is greater than N, then a modulo operation remaps
that index value to a number less than N to determine which style
element to use.
Discussion: Indexing
can be used to collapse the number of groups that are represented
in a graph. For more information, see Remapping Groups for Grouped Data.
specifies the attributes
of the vector line and arrowhead. See General Syntax for Attribute Options for the syntax
on using a style-element and Line Options for available line-options.
specifies that the
data columns for this plot and the plot type be used for determining
default axis features.
Details: This
option is needed only when two or more plots within an overlay-type
layout contribute to a common axis. For more information, see When Plots Share Data and a Common Axis.
specifies user-defined
roles that can be used to display information in the tooltips.
Requirement: The
role names that you choose must be unique and different from the pre-defined
roles X, Y, DATALABEL, XORIGIN, YORIGIN, GROUP, and INDEX.
This option provides
a way to add to the data columns that appear in tooltips specified
by the TIP= option.
specifies the information
to display when the cursor is positioned over a vector line. If this
option is used, it replaces all the information displayed by default.
Roles for columns that do not contribute to the vector plot can be
specified along with roles that do.
Default: The
columns assigned to these roles are automatically included in the
tooltip information: X, Y, DATALABEL, XORIGIN, YORIGIN, and GROUP.
an ordered, blank-separated
list of unique VECTORPLOT and user-defined roles. VECTORPLOT roles
include X, Y, DATALABEL, XORIGIN, YORIGIN, GROUP, and INDEX.
User-defined roles
are defined with the ROLENAME= option.
Requirement: To
generate tooltips, you must include an ODS GRAPHICS ON statement that
has the IMAGEMAP option specified, and write the graphs to the ODS
HTML destination.
Interaction: The
labels and formats for the TIP variables can be controlled with the TIPLABEL= and TIPFORMAT= options.
specifies whether data
are mapped to the primary X (bottom) axis or to the secondary X2 (top)
axis.
Interaction: The
overall plot specification and the layout type determine the axis
display. For more information, see How Axis Features Are Determined.
specifies whether data
are mapped to the primary Y (left) axis or to the secondary Y2 (right)
axis.
Interaction: The
overall plot specification and the layout type determine the axis
display. For more information, see How Axis Features Are Determined.