Example Program and Statement Details
Example Program
proc template;
define statgraph boxplotparm1;
begingraph;
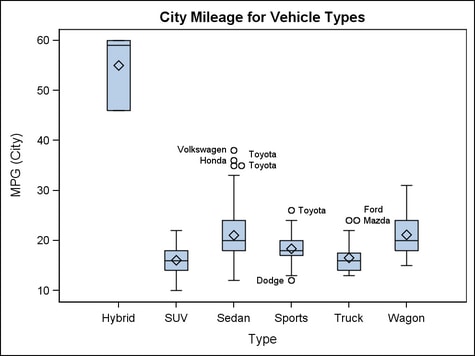
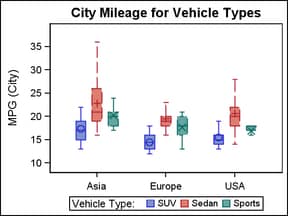
entrytitle "City Mileage for Vehicle Types";
layout overlay;
boxplotparm y=value x=x stat=stat /
datalabel=datalabel spread=true ;
endlayout;
endgraph;
end;
run;
proc sgrender data=boxdata template=boxplotparm1;
run;
The following input
data generated the box for Sedan in the graph. See Generalized Macro for BOXPLOTPARM Data to see the code for creating all of the data.
Statement Summary
The BOXPLOTPARM statement
requires pre-computed input data. One reason to choose this statement
over the BOXPLOT statement is that you can control the computational
technique used to compute various statistics for the box plot, such
as the mean, quartiles, location of fences, outlier definition, and
so on. See Generalized Macro for BOXPLOTPARM Data for examples of such computations
using PROC SUMMARY and multiple DATA steps.
The BOXPLOTPARM statement
displays a single box if given just Y and a STAT argument. It displays
multiple boxes if given both Y and X and a STAT argument and X has
more than one unique value.
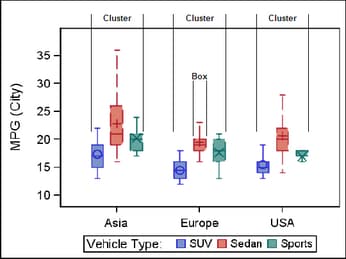
By default for numeric
or character columns, the category (X) axis is TYPE=DISCRETE. You
can override the default and specify TYPE=LINEAR in the parent layout,
provided that the X column is numeric. The axis for the analysis (Y)
column is always LINEAR. When the X axis is LINEAR, you can use the
INTERVALBOXWIDTH= option to specify the box width.
When ORIENT=VERTICAL, the X (or X2) axis is used for the X column and
the Y (or Y2) axis is used for the Y column. When ORIENT=HORIZONTAL,
the X (or X2) axis is used for the Y column and the Y (or Y2) axis
is used for the X column.
Two basic box plot representations
can be drawn with the BOXPLOTPARM statement: a schematic
(Tukey) box plot and a skeletal
box plot. See the EXTREME= option for details.
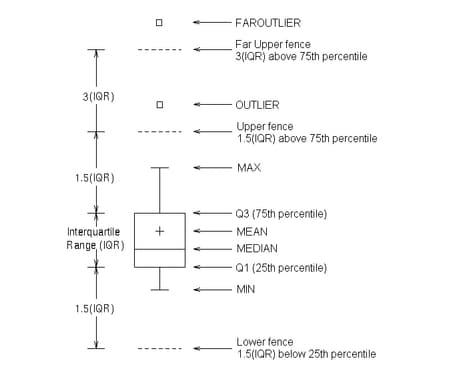
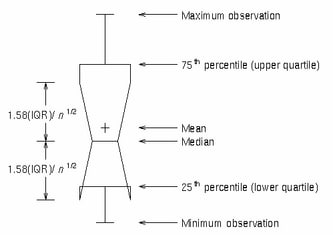
As shown in the figure,
the bottom and top edges of the box are located at the 1st quartile
(25th percentile) and 3rd quartile (75th percentile) of the sample.
Within the box, you can display the median (50th percentile) as a
line and the mean as a marker (see the DISPLAY= option).
You can also display
markers and data labels for outliers. Outliers are observations that
are more extreme than the upper and lower fences ( ). Outliers that are beyond upper and lower far fences
(
). Outliers that are beyond upper and lower far fences
( ) are called FAR OUTLIERS and can also be identified
and labeled. From a graphical perspective, the location of fences
along the axis are known, but there is no line or marker that displays
a fence. (See DISPLAY=, LABELFAR=, and DATALABEL= options).
) are called FAR OUTLIERS and can also be identified
and labeled. From a graphical perspective, the location of fences
along the axis are known, but there is no line or marker that displays
a fence. (See DISPLAY=, LABELFAR=, and DATALABEL= options).
). Outliers that are beyond upper and lower far fences
() are called FAR OUTLIERS and can also be identified
and labeled. From a graphical perspective, the location of fences
along the axis are known, but there is no line or marker that displays
a fence. (See DISPLAY=, LABELFAR=, and DATALABEL= options).
Finally, you can control
the range represented by the whiskers. By default, the whiskers are
drawn from the upper edge of the box to the MAX value, and from the
lower edge of the box to the MIN value. (See the EXTREME= option.)
Input Data Requirements for the BOXPLOTPARM Statement
At a minimum, valid
data for the BOXPLOTPARM statement must provide a numeric column (Y=)
that contains calculated statistics for an analysis, and a string
column (STAT=) that identifies each statistic. The Y column must contain
nonmissing values for the Q1 (25th percentile) and Q3 (75th percentile)
statistics. If Y values are missing or not supplied for other statistic
values, then those statistics are not displayed in the plot, regardless
of syntax requests to display them.
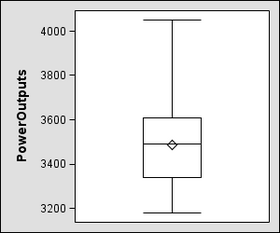
For example, a petroleum
company uses a turbine to heat water into steam that is pumped into
the ground to make oil more viscous and easier to extract. This process
occurs 20 times daily, and the amount of power (in kilowatts) used
to heat the water to the desired temperature is recorded. The following
data show the statistics that are calculated for one day of this process:
To plot the data from
the preceding table, the following BOXPLOTPARM statement uses the
Y= and STAT= arguments to generate a single box plot for the recorded
statistics:
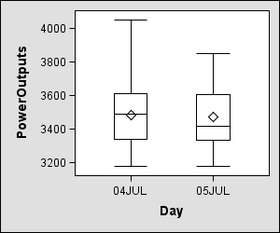
If the data contain
statistics for multiple days of the process, a third column in the
data must be present to identify the days that the statistics were
recorded. For example, the following data show the statistics that
are calculated for two days of this process:
To plot the data from
the preceding table, the BOXPLOTPARM statement needs the Y=, STAT=,
and X= arguments to generate a separate box plot for each day that
the statistics were recorded:
See Generalized Macro for BOXPLOTPARM Data for a more complete example of providing input data for
BOXPLOTPARM.
Arguments
specifies the column
for the Y values. The Y values must be the statistical values needed
for the box plot. At a minimum, there must be nonmissing values for
the 25th and 75th percentiles.
specifies the column
for the X values. The X values must qualify or classify the values
in the Y column. This optional argument is used to create a plot box
for each classifier.
specifies the statistic
that is represented by the value in the Y column. Valid STAT= values
include the following (the Requirement paragraph
that follows this list of STAT= values shows the data restrictions
that apply to the STAT= specifications):
an observation outside
the lower and upper fences. The fences are located at a distance 1.5
times the Interquartile Range (IQR = Q3–Q1) above and below
the box. The outliers are labeled when the DATALABEL= option is used.
an observation outside
the lower and upper far fences. The far fences are located at a distance
3 times the Interquartile Range (IQR = Q3–Q1) above and below
the box. The far outliers are labeled when the DATALABEL= option is
used. Specify that LABELFAR=TRUE to label only the far outliers
but not the outliers.
subgroup sample size.
The N value is not shown in the plot but is used to calculate notch
locations when the DISPLAY= option displays notches.
width of a box as a
ratio of the maximum possible width. The range of values is 0 (narrowest)
to 1 (widest). The default is 0.4. If the Y value corresponding to
BOXWIDTH is in range, it overrides the setting that is specified in
the BOXWIDTH= option.
Options
specifies the width
of a box as a ratio of the maximum possible width.
Interaction: This
setting is overridden by the Y value whenever STAT=BOXWIDTH and the corresponding Y value is in range.
Interaction: For
grouped box plots with a discrete X (category) axis, the box width
is a percentage of the CLUSTERWIDTH.
specifies the shape
at the ends of the whiskers.
Interaction: The
cap color and the thickness are specified by the WHISKERATTRS= option. The cap pattern is always
solid.
specifies the width
of the group clusters as a fraction of the midpoint spacing on a discrete
axis or a fraction of the minimum interval between adjacent data values
on an interval axis.
Interaction: For
this option to take effect, the GROUP= option must also be specified, and the GROUPDISPLAY= option must be set to CLUSTER.
specifies that a connect
line joins a statistic from box to box.
Requirement: The DISPLAY= option must contain the CONNECT display-option for
the connect line to be displayed.
specifies the attributes
of the lines connecting multiple boxes. See General Syntax for Attribute Options for the syntax
on using a style-element and Line Options for available line-options.
specifies the color
and font attributes of the outlier labels. See General Syntax for Attribute Options for the syntax
on using a style-element and Text Options for available text-options.
specifies the degree
of the transparency of the box outlines, box fill, whiskers, mean,
median, caps, connect lines, and outliers, if displayed.
Tip: The FILLATTRS= option can be used to set transparency
for just the interior fill area of the boxes. You can combine this
option with FILLATTRS= to set one transparency for the box outlines
and the whiskers, mean, median, caps, and connect lines, but a different
transparency for the box fills. Example:
datatransparency=0.2 fillattrs=(transparency=0.6)
specifies an amount
to offset all boxes from the discrete X ticks.
Range: -0.5
to +0.5, where .5 represents half the distance between discrete
ticks. A positive offset is to the right when ORIENT=VERTICAL, and
up when ORIENT=HORIZONTAL. (If the layout's axis options set REVERSE=TRUE,
then the offset direction is also reversed.)
Details: This
feature is useful for graphing multiple response variables side by
side on a common axis. By default within an overlay-type layout, if
multiple BOXPLOTPARM statements are used with different analysis variables,
the boxes for matching X values are centered on the ticks. Depending
on the data, the boxes might be superimposed. The following code fragment
shows the default box positioning:
layout overlay / cycleattrs=true
    yaxisopts=(label="Miles Per Gallon");

  boxplotparm x=type y=mpg_city stat=y_stat    / name="City" ;
  boxplotparm x=type y=mpg_highway stat=y_stat / name="Highway" ;

  discretelegend "City" "Highway";
endlayout;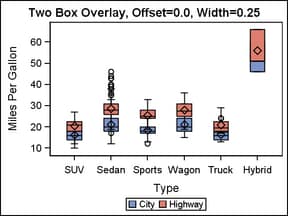
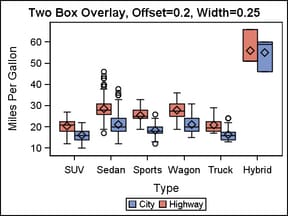
To place the different
response values side by side, you can assign a different offset to
each BOXPLOTPARM statement. The BOXWIDTH= option can be used in conjunction
with the DISCRETEOFFSET= option to create narrower boxes when desired.
layout overlay / cycleattrs=true
    yaxisopts=(label="Miles Per Gallon");

  boxplotparm x=type y=mpg_city stat=y_stat    / name="City"
    discreteoffset=.2 ;
  boxplotparm x=type y=mpg_highway stat=y_stat / name="Highway"
    discreteoffset=-.2 ;

  discretelegend "City" "Highway";
endlayout;
specifies which additional
features of the box plot to display.
Default: The
GraphBox:DisplayOpts style reference. If this style element does not
exist, the default is STANDARD.
a list of features
to be displayed. The list must be enclosed in parentheses and can
include any of the following:
| CAPS | displays caps at the ends of the whiskers |
| CONNECT | displays the line connecting multiple boxes |
| FILL | displays filled boxes |
| MEAN | displays the mean symbol within the box |
| MEDIAN | displays the median line within the box |
| NOTCHES | displays notched boxes |
| OUTLIERS | displays markers for the outliers |
Restriction: The
display features requested can be displayed only if the input data
includes this information.
To control the appearance
of these features, use the CONNECTATTRS=, FILLATTRS=, MEANATTRS=, MEDIANATTRS=, OUTLIERATTRS=, and WHISKERATTRS= options. The WHISKERATTRS= option
controls affects both CAPS and WHISKERS.
specifies the statistics
to be displayed for each box.
specifies a list of
features to be displayed. The list must be enclosed in parentheses
and can include any of the following:
| MAX | Maximum data value below the box upper fence |
| MEAN | Mean data value for box |
| MEDIAN | Median data value for box |
| MIN | Minimum data value above the box upper fence |
| N | Number of observations for box |
| Q1 | Lower quartile (25th percentile) for box |
| Q3 | Upper quartile (75th percentile) for box |
| STD | Standard deviation of the data for box |
| RANGE | Range of the data (MAX–MIN) |
| IQR | Interquartile range (Q3–Q1) |
specifies whether the
whiskers can extend beyond the fences.
Interaction: This
option overrides the DATALABEL=, DATALABELATTRS=, LABELFAR=, OUTLIERATTRS=, and SPREAD= options.
Fences are locations
above and below the box. The upper and lower fences are located at
a distance 1.5 times the Interquartile Range (IQR) (IQR = Q3–Q1).
The upper and lower far fences are located at a distance 3 times the
IQR. (SeeExample Program and Statement Details .)
specifies the appearance
of the interior fill area of the boxes. See General Syntax for Attribute Options for the syntax
on using a style-element and Fill Options for available fill-options.
Interaction: For
this option to have any effect, the fill must be enabled by the ODS
style or the DISPLAY= option.
Tip: The DATATRANSPARENCY= option sets the transparency for
the box outlines, box fill, whiskers, mean, median, caps, connect
lines, and outliers. You can combine this option with DATATRANSPARENCY=
to set one transparency for the box outlines and the whiskers, mean,
median, caps, and connect lines, but a different transparency for
the box fills. Example:
datatransparency=0.2 fillattrs=(transparency=0.6)
creates a box plot
for each unique group value of the specified column.
specifies
a discrete attribute variable that is defined in a DISCRETEATTRVAR statement.
-
If the MEDIAN, CAPS, or NOTCHES are enabled by the DISPLAY= option, each of these features uses the same color as the box outline. Line styles do not change by group value.
-
If the MEAN or OUTLIERS are enabled by the DISPLAY= option, each distinct group value is represented by a different marker. The markers are defined by the MarkerSymbol and ContrastColor attributes of the GraphData1–GraphDataN style elements. A marker is used for both MEAN and OUTLIERS, if displayed.
Interaction: By
default, the group values are mapped in the order of the data. The GROUPORDER= option can be used to control the
sorting order of the group values. The INDEX= option can be used to alter the default sequence of colors
and markers.
Interaction: The
INCLUDEMISSINGGROUP option controls whether missing group values are
considered a distinct group value.
Tip: The
representations that are used to identify the groups can be overridden
individually. For example, each distinct group value is represented
by a different line pattern for the box outlines, but the PATTERN=
setting on the OUTLIERATTRS= option could be used to assign the
same line pattern to all box outlines and connect lines.
specifies whether missing
values of the group variable are included in the plot.
Tip:
Unless a discrete attribute map is in effect or the INDEX= option
is used, the attributes of the missing group value are determined
by the GraphMissing style element except when the MISSING= system
option is used to specify a non-default missing character or when
a user-defined format is applied to the missing group value. In those
cases, the attributes of the missing group value are determined by
a GraphData1–GraphDataN style element.
specifies indices for
mapping line attributes (color and pattern) to one of the GraphData1–GranphDataN
style elements.
Restriction: If
the value of the numeric-column is
missing or is less than 1, the observation is not used in the analysis.
If the value is not an integer, only the integer portion is used.
Interaction: All
of the indexes for a specific group value must be the same. Otherwise,
the results are unpredictable.
Interaction: The
index values are 1-based indices. For the style definitions in GraphData1–GraphDataN,
if the index value is greater than N, then a modulo operation remaps
that index value to a number less than N to determine which style
to use.
Discussion: Indexing
can be used to collapse the number of groups that are represented
in a graph. For more information, see Remapping Groups for Grouped Data.
specifies the box width
when an interval category (X) column is specified.
| AUTO | Uses 85% of the smallest interval between any two boxes for the given plot. |
| dimension | Sets the box width to the specified value. |
specifies whether all
outliers or only far outliers are labeled. For more information about
outliers, see the Example Program and Statement Details.
specifies the attributes
of the marker representing the mean within the box. See General Syntax for Attribute Options for the syntax
on using a style-element and Marker Options for available marker-options.
specifies the appearance
of the line representing the median within the box. See General Syntax for Attribute Options for the syntax
on using a style-element and Line Options for available line-options.
specifies the attributes
of the markers representing the outliers. See General Syntax for Attribute Options for the syntax
on using a style-element and Marker Options for available marker-options.
specifies the information
to display when the cursor is positioned over an outlier. If this
option is used, it replaces all of the information that is displayed
by default. Roles for columns that do not contribute to the box plot
can be specified along with roles that do contribute.
Default: The
columns assigned to these roles are automatically included in the
tooltip information: X and Y.
an ordered, blank-separated
list of unique BOXPLOTPARM roles. BOXPLOTPARM roles for OUTLIERTIP
include X, Y, STAT, and DATALABEL.
Requirement: To
generate tooltips, you must include an ODS GRAPHICS ON statement that
has the IMAGEMAP option specified, and write the graphs to the ODS
HTML destination.
Interaction: The
labels and formats for the OUTLIERTIP variables can be controlled
with the TIPLABEL= and TIPFORMAT= options.
specifies the appearance
of the box outline. See General Syntax for Attribute Options for the syntax
on using a style-element and Line Options for available line-options.
specifies that the
data columns for this plot and the plot type be used for determining
default axis features.
Details: This
option is needed only when two or more plots within an overlay-type
layout contribute to a common axis. For more information, see When Plots Share Data and a Common Axis.
specifies user-defined
roles that can be used to display information in the tooltips.
Requirement: The
role names that you choose must be unique and different from the pre-defined
roles X, Y, STAT, DATALABEL , N, STD, MIN, MAX, MEAN, MEDIAN, Q1,
Q3, and BOXWIDTH.
This option provides
a way to add to the data columns that appear in tooltips that are
specified by the OUTLIERTIP= and TIP= options.
specifies whether outliers
with the same value are spread out to avoid overlap. For vertical
box plots this means offsetting the outliers horizontally. If this
option is false, outliers with the same value are plotted in the same
position. Thus, only one is visible
specifies the information
to display when the cursor is positioned over a box or whisker in
the box plot. If this option is used, it replaces all of the information
that is displayed by default. Roles for columns that do not contribute
to the box plot can be specified along with roles that do contribute.
Default: The
columns assigned to these roles are automatically included in the
tooltip information: X, N, MIN, MAX, Q1, Q3, MEAN, MEDIAN, and STD.
an ordered, blank-separated
list of unique BOXPLOTPARM roles. BOXPLOTPARM roles for TIP include
X, N, STD, MIN, MAX, MEAN, MEDIAN, Q1, Q3 and BOXWIDTH.
User-defined roles
are defined with the ROLENAME= option.
Requirement: To
generate tooltips, you must include an ODS GRAPHICS ON statement that
has the IMAGEMAP option specified, and write the graphs to the ODS
HTML destination.
Requirement: If
a user-defined role is specified in the ROLENAME= option, then the
data values for that role must be identical for each distinct X (category)
value.
Interaction: The
labels and formats for the TIP variables can be controlled with the TIPLABEL= and TIPFORMAT= options.
See Also: The ROLENAME= option for specifying user-defined roles. The OUTLIERTIP= option for specifying the information
to display when the cursor is positioned over an outlier.
specifies display formats
for the information that is defined by the tooltip roles.
Default: The
column format of the variable assigned to the role or BEST6. if no
format is assigned to a numeric column.
Requirement: This
option provides a way to control the formats of columns that appear
in tooltips. Only the roles that appear in the OUTLIERTIP or TIP options are used.
specifies display labels
for the information that is defined by the tooltip roles.
Requirement: This
option provides a way to control the labels of columns that appear
in tooltips. Only the roles that appear in the OUTLIERTIP= or TIP= options are used.
specifies the line
properties of the whiskers and caps. See General Syntax for Attribute Options for the syntax
on using a style-element and Line Options for available line-options.
specifies whether data
are mapped to the primary X (bottom) axis or to the secondary X2 (top)
axis.
Interaction: The
overall plot specification and the layout type determine the axis
display for the specified axis. For more information, see How Axis Features Are Determined.
specifies whether data
are mapped to the primary Y (left) axis or to the secondary Y2 (right)
axis.
Interaction: The
overall plot specification and the layout type determine the axis
display for the specified axis. For more information, see How Axis Features Are Determined.