Example Program and Statement Details
Example Graph
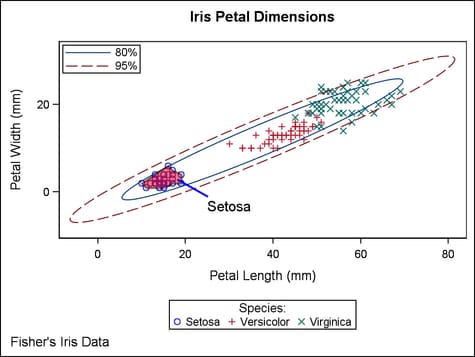
The following graph
was generated by the Example Program. The example
uses a BEGINPOLYGON block to draw a polygon around the Setosa species
of Iris in a plot that shows petal sizes for three Iris species. The
DRAWSPACE= option in the BEGINGRAPH statements specifies that the
polygon be drawn in the data space. The BEGINPOLYGON statement specifies
the starting X,Y point. For the BEGINPOLYGON options, DISPLAY= displays
both a fill and an outline for the polygon. TRANSPARENCY= adds a degree
of transparency to the fill and outline, and FILLATTRS= colors the
fill red. The example also uses DRAWLINE and DRAWTEXT statements to
draw a callout to the polygon.
Example Program
proc template;
  define statgraph discretelegend;
    begingraph / drawspace=datavalue;
	  entrytitle "Iris Petal Dimensions";
	  layout overlayequated / equatetype=equate;
        scatterplot x=petallength y=petalwidth / group=species name="s";
        ellipse x=petallength y=petalwidth / type=predicted  alpha=.2
          name="p80" legendlabel="80%" outlineattrs=graphconfidence;
	    ellipse x=petallength y=petalwidth / type=predicted  alpha=.05
          name="p95" legendlabel="95%" outlineattrs=graphconfidence2;

        beginpolygon x=10 y=2 /display=all
            transparency=0.5 fillAttrs=(color=red) ;
          draw x=13 y=4 ;
          draw x=16 y=6 ;
          draw x=17 y=5 ;
          draw x=19 y=4 ;
          draw x=19 y=2 ;
          draw x=17 y=2 ;
          draw x=15 y=1 ;
          draw x=14 y=1 ;
          draw x=11 y=1 ;
        endpolygon ;
        drawtext textattrs=(size=11pt) "Setosa" /
          x=30 y=-1 width=12 anchor=top;
        drawline x1=18 y1=3 x2=25 y2=-1 / lineattrs=(color=blue);

        discretelegend "s" / title="Species:";
	    discretelegend "p80" "p95" /across=1 autoalign=(topleft) location=inside;
      endlayout;
	  entryfootnote halign=left "Fisher's Iris Data" ;
    endgraph;
  end;

proc sgrender data=sashelp.iris template=discretelegend;
run;
Statement Summary
A polygon is built by
using the BEGINPOLYGON statement to specify the polygon’s starting
X,Y coordinate, and then specifying the remaining points by nesting
a series of DRAW statements (see DRAW Statement) within the BEGINPOLYGON block. The block is closed with
an ENDPOLYGON statement. To manage the location and drawing units
for the polygon, you can use the XAXIS=, YAXIS=, XSPACE=, and YSPACE=
options.
For general
information about the types of elements that can be drawn with the
draw statements, the drawing space and drawing units that they use,
and how the drawn elements are anchored, see Key Concepts for Using Draw Statements. For detailed usage information, consult the SAS Graph Template Language: User's Guide.
Options
specifies an amount
to offset the polygon from discrete X values, or discrete Y values,
or both.
DRAWSPACE= GRAPHPERCENT | GRAPHPIXEL | LAYOUTPERCENT | LAYOUTPIXEL
| WALLPERCENT | WALLPIXEL | DATAPERCENT | DATAPIXEL | DATAVALUE
specifies a default
drawing space and drawing units for this BEGINPOLYGON block.
Interaction: This statement and all of the draw statements inherit the global
DRAWPSACE= setting from the DRAWSPACE= option in the BEGINGRAPH statement.
Setting this option changes the setting for only this BEGINPOLYGON
statement.
specifies the properties
of the polygon’s filled area. See General Syntax for Attribute Options for the syntax
on using a style-element and Fill Options for available fill-options.
Tip: The TRANSPARENCY= option sets the transparency for
the fill and the outline. You can combine this option with TRANSPARENCY=
to set one transparency for the outlines but a different transparency
for the fill. Example:
transparency=0.2 fillattrs=(transparency=0.6)
specifies whether the
polygon appears on top of (FRONT) or behind (BACK) the graph.
Interaction: If this option is set to BACK, the polygon is drawn behind background
areas, such as a layout or legend background. For elements that are obstructed because they are in the
back layer, you can suppress the display of filled areas in the graph.
Or, you can use transparency to manage the element visibility. For
more information, see About Drawing Layers.
specifies the properties
of the outline that is drawn around the polygon. See General Syntax for Attribute Options for the syntax
on using a style-element and Line Options for available line-options.
Interaction: For this option to have any effect, the outline must be enabled
by the DISPLAY= option.
specifies the degree
of the transparency of the fill and the outline.
Tip: The FILLATTRS option can be used to set transparency
for just the polygon’s filled area. You can combine this option
with FILLATTRS= to set one transparency for the outlines but a different
transparency for the fill. Example:
transparency=0.2 fillattrs=(transparency=0.6)
XSPACE= GRAPHPERCENT | GRAPHPIXEL | LAYOUTPERCENT | LAYOUTPIXEL
| WALLPERCENT | WALLPIXEL | DATAPERCENT | DATAPIXEL | DATAVALUE
specifies the drawing
space and drawing units for interpreting the X value.