Example Program and Statement Details
Example Graph
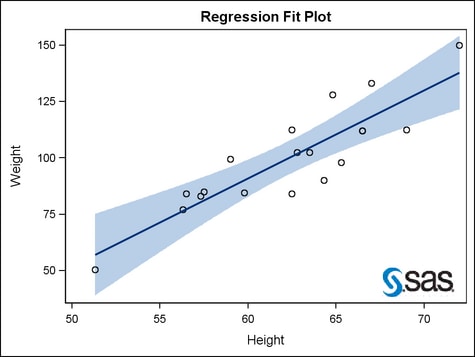
The following graph
was generated by the Example Program. The example
shows how to display an image in the bottom right corner of the graph
wall.
Example Program
proc template;
  define statgraph image;
    begingraph;
      entrytitle "Regression Fit Plot";
      layout overlay;
        modelband "myclm";
        scatterplot x=height y=weight / primary=true;
        regressionplot x=height y=weight / alpha=.01 clm="myclm";
        drawimage "c:\temp\saslogo.gif" /
          anchor=bottomright x=98 y=2
          drawspace=wallpercent ;
      endlayout;
    endgraph;
  end;

proc sgrender data=sashelp.class template=image;
run;
Statement Summary
A DRAWIMAGE statement
draws an image in a graph. By default, the image is drawn in the center
of the graph. You can change the default position with the options
ANCHOR=, X=, Y=, XSPACE=, and YSPACE=. By default, the image is drawn
in the actual image size. You can change the default size with the
WIDTH= and HEIGHT= options.
For general
information about the types of elements that can be drawn with the
draw statements, the drawing space and drawing units that they use,
and how the drawn elements are anchored, see Key Concepts for Using Draw Statements. For detailed usage information, consult the SAS Graph Template Language: User's Guide.
Required Argument
Options
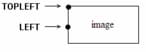
specifies an anchor
point for the image.
Discussion: The anchor point can be at the center of the image or at eight points
on the border of the image bounding box. The following figure shows
the anchor points for TOPLEFT and LEFT.
The coordinates of
the anchor point are set by the X= and Y= options, and by the XSPACE=
and YSPACE= options. The XAXIS= and YAXIS= option might affect positioning
when the XSPACE= or YSPACE= options are set to DATAPIXEL, DATAPERCENT,
or DATAVALUE.
The image has a fixed
height and a fixed width, determined by the HEIGHT=, HEIGHTUNIT=,
WIDTH= and WIDTHUNIT= options. The height of the text grows in a direction
that is related to the anchor point. For example, if ANCHOR=TOPLEFT,
the image height extends downward from the anchor point and its width
extends to the right. If ANCHOR=CENTER, half the image width and half
the image height extend equally left and right, as well as top to
bottom from the anchor point. If ANCHOR=BOTTOM, the image height extends
upward from the anchor point and the image width is centered at the
anchor point.
specifies the properties
of the border line that is drawn around the image. See General Syntax for Attribute Options for the syntax
on using a style-element and Line Options for available line-options.
DRAWSPACE= GRAPHPERCENT | GRAPHPIXEL | LAYOUTPERCENT | LAYOUTPIXEL
| WALLPERCENT | WALLPIXEL | DATAPERCENT | DATAPIXEL | DATAVALUE
specifies a default
drawing space and drawing units for this DRAWIMAGE statement.
Interaction: This statement and all of the draw statements inherit the global
DRAWPSACE= setting from the DRAWSPACE= option in the BEGINGRAPH statement.
Setting this option changes the setting for only this DRAWIMAGE statement.
specifies whether the positive-number that is specified in the HEIGHT=
option is interpreted as a percentage value, a pixel value, or a value
that is in the units of the data.
specifies whether the
image appears on top of (FRONT) or behind (BACK) the graph.
Interaction: If this option is set to BACK, the image is drawn behind background
areas, such as a layout or legend background.For elements that are obstructed because they are in the
back layer, you can suppress the display of filled areas in the graph.
Or, you can use transparency to manage the element visibility. For
more information, see About Drawing Layers.
specifies the angle
of rotation for the image, measured in degrees. The angle is measured
as if a horizontal line extended to the right through the image anchor
point. Positive angles rotate the image counter clockwise, and negative
angles rotate the image clockwise. The angle specification can exceed
360 degrees in absolute value.
specifies how the image
is scaled within the bounding box.
| FIT | Scale the image to fit the bounding box. Aspect ratio is not maintained. |
| FITHEIGHT | Scale the image to fit the height of the bounding box. The width is computed from the height and the image's aspect ratio. |
| FITWIDTH | Scale the image to fit the width of the bounding box. The height is computed from the width and the image's aspect ratio. |
| TILE | Tile the image as needed to fit the bounding image. The last tile in a row or column might be clipped by the bounding box. |
specifies whether the positive-number that is specified in the WIDTH=
option is interpreted as a percentage value, a pixel value, or a value
that is in the units of the data.
XSPACE= GRAPHPERCENT | GRAPHPIXEL | LAYOUTPERCENT | LAYOUTPIXEL
| WALLPERCENT | WALLPIXEL | DATAPERCENT | DATAPIXEL | DATAVALUE
specifies the drawing
space and drawing units for interpreting the value that is specified
in the X= option.