Example Program and Statement Details
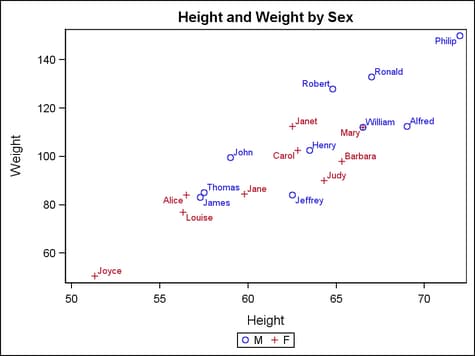
Example Program
proc template;
define statgraph scatterplot;
begingraph;
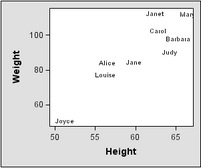
entrytitle "Height and Weight by Sex";
layout overlay;
scatterplot x=height y=weight /
group=sex name="scatter" datalabel=name;
discretelegend "scatter";
endlayout;
endgraph;
end;
run;
proc sgrender data=sashelp.class template=scatterplot;
run;
Options
specifies a style element
to be used with the MARKERCOLORGRADIENT= option.
name of a style element.
The style element should contain these style attributes:
| STARTCOLOR | color for the smallest data value of the column that is specified on the MARKERCOLORGRADIENT= option |
| NEUTRALCOLOR | color for the midpoint of the range of the column that is specified on the MARKERCOLORGRADIENT= option |
| ENDCOLOR | color for the highest data value of the column that is specified on the MARKERCOLORGRADIENT= option |
Interaction: For
this option to take effect, the MARKERCOLORGRADIENT= option must also
be specified.
The REVERSECOLORMODEL= option can be used to reverse the
start and end colors of the ramp assigned to the color model.
specifies the width
of the group clusters as a fraction of the midpoint spacing on a discrete
axis or a fraction of the minimum interval between adjacent data values
on an interval axis.
Interaction: For
this option to take effect, the GROUP= option must also be specified, and the GROUPDISPLAY= option must be set to CLUSTER.
specifies a column
for marker labels. The label positions are adjusted to prevent them
from overlapping.
Interaction: If
a numeric column is specified
and the column has no format, a BEST6. format is applied.
Interaction: This
option is ignored if the MARKERCHARACTER= option is used, which displays labels
instead of the markers.
specifies the color
and font attributes of the data labels. See General Syntax for Attribute Options for the syntax
on using a style-element and Text Options for available text-options.
enhances the visual
appearance of the markers.
Interaction: When
a data skin is applied, all marker outlines are set by the skin, and
the outline settings are ignored from the ODS style or from MARKERATTRS= option.
specifies the size
of a marker as a fraction of the tick spacing.
Interaction: If
both of the axes are discrete, then marker size is a fraction of the
smaller tick spacing.
Interaction: For
this option to take effect, the USEDISCRETESIZE= option must be set to TRUE (the default
is FALSE).
specifies an amount
to offset all markers from discrete X values, or discrete Y values,
or both.
Default: 0
(no offset, all markers are centered on the discrete X values, or
discrete Y values, or both)
Range: –0.5
to +0.5, where .5 represents half the distance between discrete
ticks. A positive offset is to the right on discrete X values and
up on discrete Y values. If the layout’s axis options set REVERSE=TRUE,
the offset direction is also reversed.
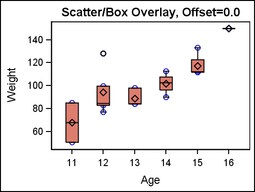
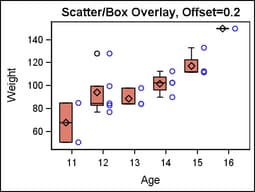
Details: This
feature is useful for graphing multiple response variables side by
side on a common axis. By default within an overlay-type layout, if
a SCATTERPLOT is used with other plots with a discrete axis, the
markers are centered on the discrete X values, or discrete Y values,
or both. Depending on the data, the markers might be superimposed
over other graph data. The following code fragment shows the default
positioning when a SCATTERPLOT is used with a BOXPLOT:
layout overlay / cycleattrs=true
     xaxisopts=(type=discrete);

  scatterplot x=age y=weight;
  boxplot x=age y=weight;

endlayout;
specifies the attributes
of the error bars that are associated with the data points. See General Syntax for Attribute Options for the syntax
on using a style-element and Line Options for available line-options.
Interaction: For
this option to take effect, error bars must be displayed by the XERRORLOWER=, XERRORUPPER=, YERRORLOWER=, or YERRORUPPER= options.
specifies a column
that indicates a frequency count for each observation of the input
data object. If n is the value
of the FREQ variable for a given observation, then that observation
is plotted n times.
creates a separate
marker type for each unique group value of the specified column.
specifies
a discrete attribute variable that is defined in a DISCRETEATTRVAR statement.
Default: Each
distinct group value might be represented in the graph by a different
combination of color and marker symbol. Markers vary according to
the ContrastColor and MarkerSymbol attributes of the GraphData1–GraphDataN
style elements.
Interaction: The
group values are mapped in the order of the data, unless the INDEX= option is used to alter the default sequence of markers
and colors.
Interaction: The
INCLUDEMISSINGGROUP option controls whether missing group values are
considered a distinct group value.
Interaction: If
the MARKERCHARACTER= and MARKERCOLORGRADIENT= options are used, their settings
override the group settings for marker symbol and marker color.
Tip: The
representations that are used to identify the groups can be overridden.
For example, each distinct group value is represented by a different
marker symbol, but the MARKERATTRS= (SYMBOL= marker)
option could be used to assign the same symbol to all of the plot’s
marker symbols, letting marker color indicate group values. Likewise,
MARKERATTRS= (COLOR= color)
could be used to assign the same color to all markers, letting marker
symbol indicate group values.
specifies the relative
position of the markers for clustered group display. It also sets
the default order of the groups in the legend.
Note: Attributes
such as color, symbol, and pattern are assigned to each group in the
DATA order by default regardless of the GROUPORDER= option setting.
Note: The
ASCENDING and DESCENDING settings linguistically sort the group values
within each category (or X value) for display position purposes only.
The data order of the observations and the visual attributes that
are assigned to the group values remain unchanged.
Tip: The CLUSTERWIDTH= option can be used to control the
distance between the group markers in a cluster
Tip: The INDEX= option can be used to alter the default sequence of visual
attributes that is assigned to the group values.
Details: By
default, the value that is set for this option determines the order
in which attributes are assigned to each group. It also determines
the order in which the groups are displayed in the legend.
specifies whether missing
values of the group variable are included in the plot.
Tip:
Unless a discrete attribute map is in effect or the INDEX= option
is used, the attributes of the missing group value are determined
by the GraphMissing style element except when the MISSING= system
option is used to specify a non-default missing character or when
a user-defined format is applied to the missing group value. In those
cases, the attributes of the missing group value are determined by
a GraphData1–GraphDataN style element.
specifies indices for
mapping marker attributes (color and symbol) to one of the GraphData1–GraphDataN
style elements.
Restriction: If
the value of the numeric-column is
missing or is less than 1, the observation is not used in the analysis.
If the value is not an integer, only the integer portion is used.
Interaction: All
of the indexes for a specific group value must be the same. Otherwise,
the results are unpredictable.
Interaction: If
the MARKERCHARACTER= and MARKERCOLORGRADIENT= options are used, their settings
override the group settings for marker symbol and marker color.
Interaction: The
index values are 1-based indices. For the style elements GraphData1–GraphDataN,
if the index value is greater than N, then a modulo operation remaps
that index value to a number less than N to determine which style
element to use.
Discussion: Indexing
can be used to collapse the number of groups that are represented
in a graph. For more information, see Remapping Groups for Grouped Data.
specifies the attributes
of the data markers. See General Syntax for Attribute Options for the syntax
on using a style-element and Marker Options for available marker-options.
Interaction: If
the MARKERCOLORGRADIENT= option is specified, this option’s
COLOR= setting is ignored.
Interaction: If
the MARKERCHARACTER= option is specified, its SYMBOL= and WEIGHT=
settings are ignored.
Interaction: If
the DATASKIN= option applies a data skin, marker outlines are determined
by the data skin and the outline settings are ignored from the ODS
style or the marker attributes.
specifies a column
that defines strings to be used instead of marker symbols.
Interaction: If
the GROUP= option is also used, color is displayed for a DISCRETE
legend, but the character is not displayed in the legend.
If the GROUP= option
is also specified, the same colors are applied to the text strings
as would have been applied to markers.
specifies the color
and font attributes of the marker character specified on the MARKERCHARACTER= option. See General Syntax for Attribute Options for the syntax
on using a style-element and Text Options for available text-options.
When the GROUP= option is also specified, each distinct group value might
be represented by a different color (depending on the ODS style setting
or the setting on the INDEX= option). The marker character that
is associated with the group is assigned the group color. This option’s
COLOR= suboption can be used to specify a single color for all marker
characters in a graph, without affecting items that have the group
color, such as error bars and marker symbols.
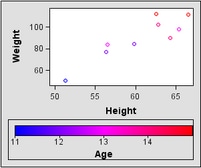
specifies the column
that is used to map marker colors to a continuous gradient.
specifies
a range attribute variable that is defined in a RANGEATTRVAR statement.
Restriction: A
range attribute variable specification must be a direct reference
to the attribute variable. It cannot be set as a dynamic variable.
Tip: The
marker colors are derived from the RANGEALTCOLOR= or RANGEALTCOLORMODEL= option in the RANGEATTRMAP block RANGE statements.
Restriction: To
display a legend with this option in effect, you must use a CONTINUOUSLEGEND
statement, not a DISCRETELEGEND statement.
Interaction: This
option overrides the COLOR= setting of the MARKERATTRS= or MARKERCHARACTERATTRS= option.
Tip: This
option can be used to add a second response variable to an analysis.
For example, in an analysis of weight by height, an age column might
be specified by the MARKERCOLORGRADIENT= option so that the change
in the gradient color of the markers reflects the change in age.
Tip: If
the MARKERCHARACTER= option is also used, the gradients that would be applied
to the markers are applied to the text strings.
specifies a drawing
size for the largest marker when the marker size represents response
values.
Tip: If you specify this size
as a percent, the specified value is interpreted as a percent of the
graph's height. You can control the height using the DESIGNHEIGHT=
option of the BEGINGRAPH statement, or the HEIGHT= option of the ODS
GRAPHICS statement. For a standard 640px by 480px output size, a percentage
value of 4.5% sets a maximum size of about 21px, which is approximately
the same marker size that would result from this option’s typical
default setting.
specifies a drawing
size for the smallest marker when the marker size represents response
values.
Tip: If you specify this size
as a percent, the specified value is interpreted as a percent of the
graph's height. You can control the height using the DESIGNHEIGHT=
option of the BEGINGRAPH statement, or the HEIGHT= option of the ODS
GRAPHICS statement. For a standard 640px by 480px output size, a percentage
value of 1.5% sets a minimum size of about 7px, which is approximately
the same marker size that would result from this option’s typical
default setting.
specifies a column
that is used to map the drawing size of the markers. By default, the
minimum and maximum values of this column establish a range over which
the marker sizes vary in linear proportion. The actual drawing size
of the smallest and largest marker is set automatically.
specifies that the
data columns for this plot and the plot type be used for determining
default axis features.
Details: This
option is needed only when two or more plots within an overlay-type
layout contribute to a common axis. For more information, see When Plots Share Data and a Common Axis.
specifies whether to
reverse a gradient (color ramp) defined by the COLORMODEL= option.
specifies user-defined
roles that can be used to display information in the tooltips.
Requirement: The
role names that you choose must be unique and different from the pre-defined
roles X, Y, DATALABEL, MARKERCHARACTER, MARKERCOLORGRADIENT, XERRORLOWER, XERRORUPPER, YERRORLOWER, YERRORUPPER, GROUP, and INDEX.
This option provides
a way to add to the data columns that appear in tooltips specified
by the TIP= option.
specifies the information
to display when the cursor is positioned over the scatter points.
If this option is used, it replaces all the information displayed
by default. Roles for columns that do not contribute to the scatter
plot can be specified along with roles that do.
Default: The
columns assigned to these roles are automatically included in the
tooltip information: X, Y, DATALABEL, MARKERCHARACTER, MARKERCOLORGRADIENT, XERRORLOWER, XERRORUPPER, YERRORLOWER, YERRORUPPER, FREQ, and GROUP.
an ordered, blank-separated
list of unique SCATTERPLOT and user-defined roles. SCATTERPLOT roles
include X, Y, DATALABEL, MARKERCHARACTER, MARKERCOLORGRADIENT, XERRORLOWER, XERRORUPPER, YERRORLOWER, YERRORUPPER, GROUP, and INDEX.
User-defined roles
are defined with the ROLENAME= option.
The following example
displays tooltips for the columns assigned to the roles X, XERRORUPPER and XERRORLOWER, as well as the column OBS, which
is not assigned to any pre-defined ScatterPlot role. The OBS column
must first be assigned a role.
Requirement: To
generate tooltips, you must include an ODS GRAPHICS ON statement that
has the IMAGEMAP option specified, and write the graphs to the ODS
HTML destination.
The labels and formats
for the TIP variables can be controlled with the TIPLABEL= and TIPFORMAT= options.
specifies display formats
for tip columns.
Default: The
column format of the variable assigned to the role or BEST6. if no
format is assigned to a numeric column.
Requirement: Columns
must be assigned to the roles for this option to have any effect.
See the ROLENAME= option.
This option provides
a way to control the formats of columns that appear in tooltips. Only
the roles that appear in the TIP= option are used.
specifies that the
marker size should be based on fraction of the midpoint spacing that
is set by the DISCRETEMARKERSIZE= option.
specifies whether data
are mapped to the primary X (bottom) axis or to the secondary X2 (top)
axis.
Interaction: The
overall plot specification and the layout type determine the axis
display for the specified axis. For more information, see How Axis Features Are Determined.
specifies values for
the lower endpoints on the X error bars. The error bars are drawn
from the markers to the endpoints.
The appearance of
the error bars is controlled by the ERRORBARATTRS= option.
specifies values for
the upper endpoints on the X error bars. The error bars are drawn
from the markers to the endpoints.
The appearance of
the error bars is controlled by the ERRORBARATTRS= option.
specifies whether data
are mapped to the primary Y (left) axis or to the secondary Y2 (right)
axis.
Interaction: The
overall plot specification and the layout type determine the axis
display for the specified axis. For more information, see How Axis Features Are Determined.
specifies values for
the lower endpoints on the Y error bars. The error bars are drawn
from the markers to the endpoints.
The appearance of
the error bars is controlled by the ERRORBARATTRS= option.
specifies values for
the upper endpoints on the Y error bars. The error bars are drawn
from the markers to the endpoints.
The appearance of
the error bars is controlled by the ERRORBARATTRS= option.