Example Program and Statement Details
Example Graph
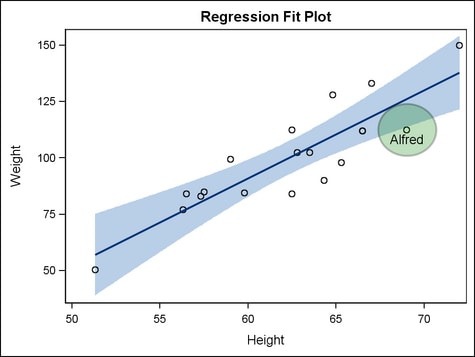
The following graph
was generated by the Example Program. The example
uses DRAWOVAL to highlight a student’s data point. It draws
an oval around the marker symbol that represents the student’s
height and weight, and it displays the student’s name inside
of the oval. In the BEGINGRAPH statement, the setting for the DRAWSPACE=
option sets the drawing space and drawing units for the DRAWOVAL and
DRAWTEXT statements. In the DRAWOVAL statement, setting TRANSPARENCY=0.75
ensures that the marker for Alfred is visible behind the oval. The
DRAWTEXT statement draws the text that identifies the student's name,
using the ANCHOR=, X=, and Y= options to position the text within
the oval.
Example Program
proc template;
  define statgraph drawoval;
    begingraph / drawspace=datavalue;
      entrytitle "Regression Fit Plot";
      layout overlay;
        modelband "myclm";
        scatterplot x=height y=weight;
        regressionplot x=height y=weight / alpha=.01 clm="myclm";
          drawoval x=69 y=112.5 width=15 height=20 /
            display=all fillattrs=(color=green)
            transparency=0.75 ;
          drawtext "Alfred" / x=69 y=112 anchor=top;
      endlayout;
    endgraph;
  end;

proc sgrender data=sashelp.class template=drawoval;
run;
Statement Summary
A DRAWOVAL statement
draws an oval in a graph. The oval position is determined by the X
and Y anchor points, and the size is determined by the HEIGHT and
WIDTH settings. You can manage the oval position with the options ANCHOR=, XSPACE=, and YSPACE=. You can manage the oval size with
the HEIGHTUNIT= and WIDTHUNIT= options.
For general
information about the types of elements that can be drawn with the
draw statements, the drawing space and drawing units that they use,
and how the drawn elements are anchored, see Key Concepts for Using Draw Statements. For detailed usage information, consult the SAS Graph Template Language: User's Guide.
Options

DRAWSPACE= GRAPHPERCENT | GRAPHPIXEL | LAYOUTPERCENT | LAYOUTPIXEL
| WALLPERCENT | WALLPIXEL | DATAPERCENT | DATAPIXEL | DATAVALUE
specifies a default
drawing space and drawing units for this DRAWOVAL statement.
Interaction: This statement and all of the draw statements inherit the global
DRAWPSACE= setting from the DRAWSPACE= option in the BEGINGRAPH statement.
Setting this option changes the setting for only this DRAWOVAL statement.
specifies the appearance
of the oval’s filled area. See General Syntax for Attribute Options for the syntax
on using a style-element and Fill Options for available fill-options.
Tip: The TRANSPARENCY= option sets the transparency for
the fill and the outline. You can combine this option with TRANSPARENCY=
to set one transparency for the outline but a different transparency
for the fill. Example:
transparency=0.2 fillattrs=(transparency=0.6)
specifies whether the
value that is specified for the oval’s HEIGHT is interpreted
as a percentage value, a pixel value, or a value that is in the units
of the data.
Interaction: This setting combines with the YSPACE= setting to interpret the height that
is set in the HEIGHT= argument.
specifies whether the
oval appears on top of (FRONT) or behind (BACK) the graph.
Interaction: If this option is set to BACK, the oval is drawn behind background
areas, such as a layout or legend background.For elements that are obstructed because they are in the
back layer, you can suppress the display of filled areas in the graph.
Or, you can use transparency to manage the element visibility. For
more information, see About Drawing Layers.
specifies the properties
of the outline that is drawn around the oval. See General Syntax for Attribute Options for the syntax
on using a style-element and Line Options for available line-options.
Interaction: For this option to have any effect, the outline must be enabled
by the DISPLAY= option or by the ODS style that is
in effect.
specifies the angle
of rotation for the oval, measured in degrees. The angle is measured
as if a horizontal line extended to the right through the oval anchor
point. Positive angles rotate the oval counter clockwise, and negative
angles rotate the oval clockwise. The angle specification can exceed
360 degrees in absolute value.
specifies the degree
of the transparency of the fill and the outline.
Tip: The FILLATTRS= option can be used to set transparency
for just the filled area. You can combine this option with FILLATTRS=
to set one transparency for the outline but a different transparency
for the fill. Example:
transparency=0.2 fillattrs=(transparency=0.6)
specifies whether the
value that is specified for the oval’s WIDTH is interpreted
as a percentage value, a pixel value, or a value that is in the units
of the data.
Interaction: This setting combines with the XSPACE= setting to interpret the width that
is set in the WIDTH= argument.
XSPACE= GRAPHPERCENT | GRAPHPIXEL | LAYOUTPERCENT | LAYOUTPIXEL
| WALLPERCENT | WALLPIXEL | DATAPERCENT | DATAPIXEL | DATAVALUE
specifies the drawing
space and drawing units for interpreting the value that is specified
for the oval’s X anchor point.