Components of a Graph

The ODS Graphics output is called a graph. In general, a graph is made of up of the following parts:
  • titles and footnotes
  • one or more cells that contain a composite of one or more plots
  • legends, which can reside inside or outside the cell or plot
The following figure shows the different parts of a graph:
Components of a Graph
components of a graph
Graph
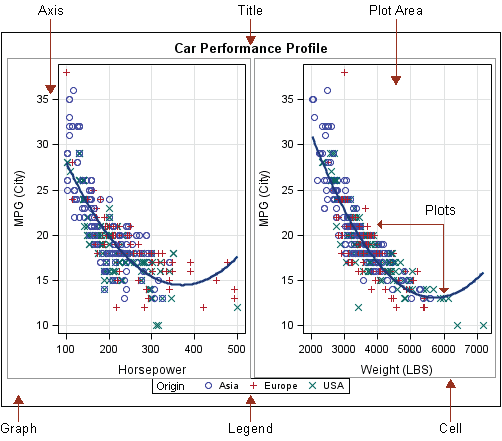
a visualization created by SAS software. The graph can contain titles, footnotes, plots, and legends.
Axis
refers collectively to the axis line, the major and minor tick marks, the major tick mark values, and the axis label.
Title
descriptive text that is displayed above any cell or plot areas in the graph.
Plot Area
the display area that contains one or more plots. This area is bounded by the axes (when present) and might also contain data labels and other text that annotates the graph.
Plot
a visual representation of data such as a scatter plot, a series line, or a histogram. Multiple plots can be overlaid in a cell to create a graph.
Cell
a distinct rectangular subregion of a graph that can contain plots, text, or legends.
Legend
refers collectively to the legend value, the legend value description, the legend label, and the legend frame.