Using the Graph Gallery

The ODS Graphics Designer provides a gallery of predefined, commonly used plots. The following display shows the default Graph Gallery:
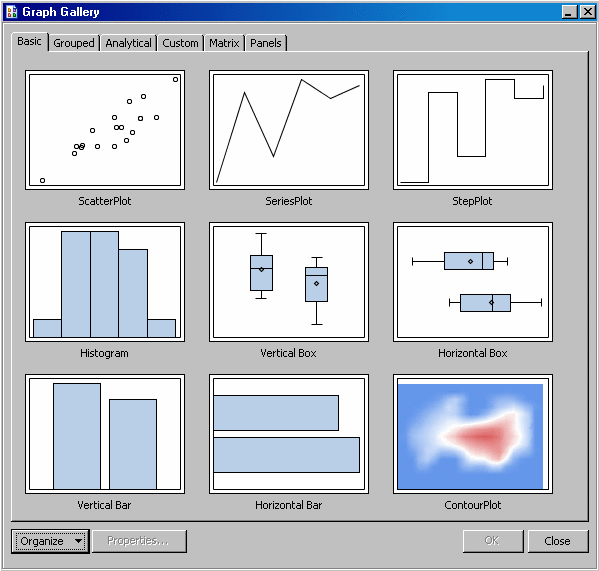
default Graph Gallery
You can choose one of these predefined graphs as the basis for your graph, and then customize your graph by adding titles, footnotes, legends, additional plots, and other items.
The Graph Gallery groups plots into categories. Each group is represented as a tab in the gallery. For example, the Grouped tab contains plots for data that has been grouped by a variable.
Here are the predefined groups:
Predefined Groups in the Graph Gallery
Groups
Description
Basic
Includes scatter plots, histograms, and other basic plots.
Grouped
Includes plots for data that has been grouped by a variable.
Analytical
Includes commonly used analytical graphs.
Custom
Includes graphs that require custom data.
Matrix
Includes various scatter plot matrices.
Panels
Includes various types of classification panel graphs.
To create a graph using the Graph Gallery:
  1. Open the gallery if it is not already open. You can open the gallery in the following ways:
    • Select Filethen selectNewthen selectFrom Graph Gallery.
    • Select Viewthen selectGraph Gallery.
  2. Select the icon for the graph that you want to create, and then click OK.
In addition to the predefined graphs, you can add your own custom graphs to the Graph Gallery. See Add a Graph to the Graph Gallery.