A Quick Look at the User Interface
In addition
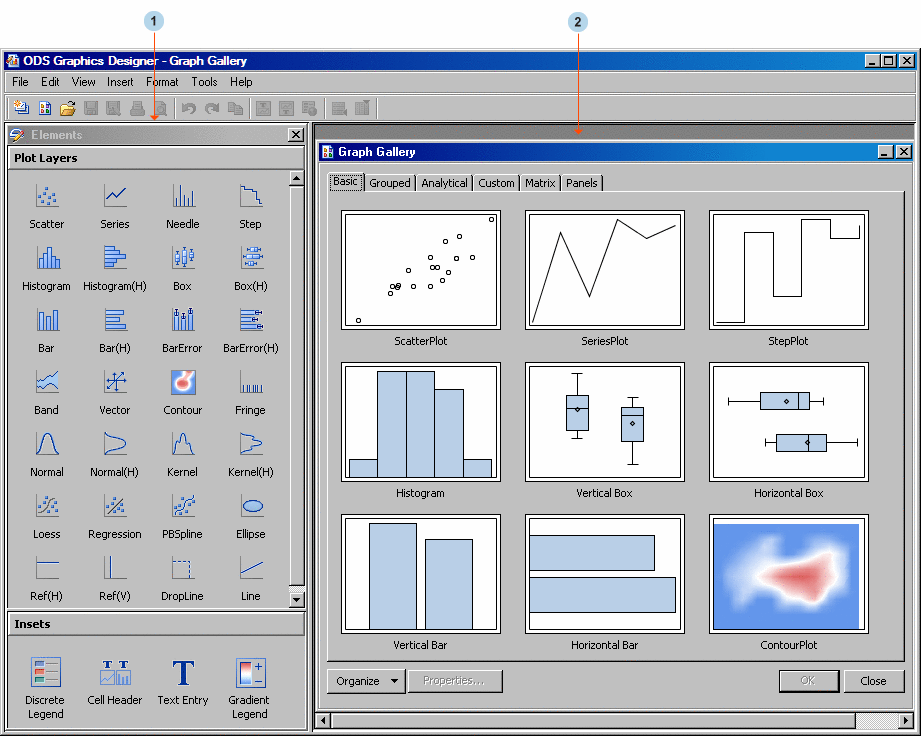
to the standard menu and toolbar, the SAS/GRAPH ODS Graphics Designer
graphical user interface consists of two main components, as shown
in the following display:
Contains one or more
graphs that you can design. In addition to the graphs, you can display
the Graph Gallery, a collection of predefined graphs that are supplied
with the software. You can design a graph from the Graph Gallery by
double-clicking one of the graph icons and then making your changes.
(Alternatively, you can design your graph from a blank graph without
using the Graph Gallery.)


