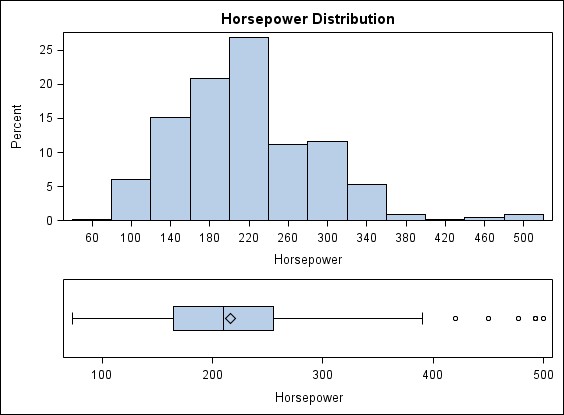
Add Rows and Columns to a Graph
A graph
can contain multiple cells, each cell with one or more plots. Each
cell is defined independently and can contain different types of plots.
The cells are arranged in rows and columns. For more information
about cells, see Components of a Graph.
You can
add multiple rows and columns to a graph. The limit to the number
of rows and columns that you can add depends on the size of your graph.
As you add more rows and columns, the individual cells shrink proportionally.
-
Assign data to the plot. For more information, see Assigning Data to a Plot.
