Example Use Case: Fortune 100 Boards of Directors
Introduction to the Boards of Directors Example
This example
describes how to use SAS/GRAPH Network Visualization Workshop to investigate
relationships among boards of directors of Fortune 100 companies circa
the year 2001. The goal is to identify influential board members and
uncover relationships among companies that share common directors.
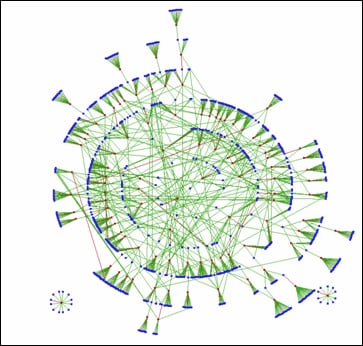
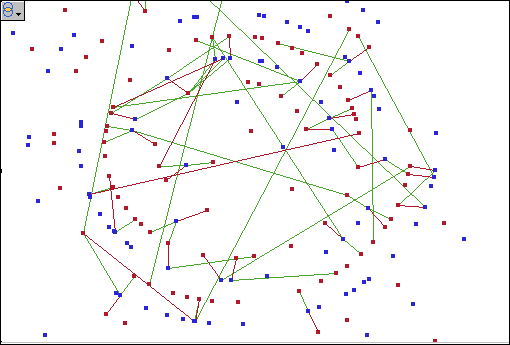
A visualization
of this data is shown in the following figure. The blue nodes in the
network represent directors or chief executive officers (CEOs), and
the red nodes represent corporations. Each arc links a director to
a corporation. The red arcs link CEOs and their corporations, while
green arcs link general directors and their corporations.
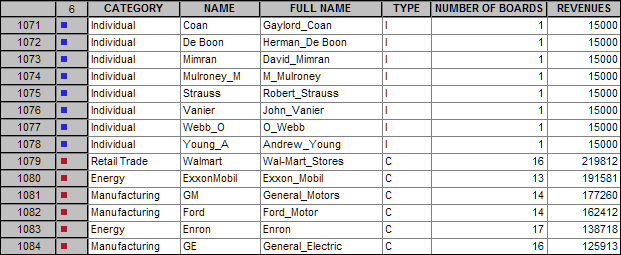
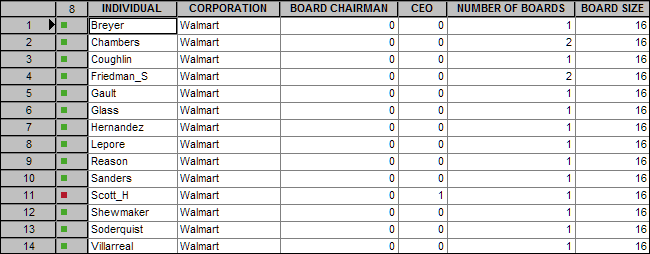
About the Data Used in the Example
Identifying Corporate Bonds
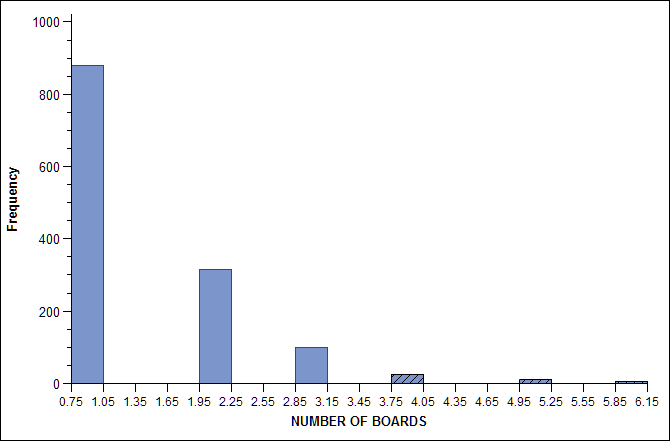
The density
of the network makes it difficult to detect patterns involving individuals
and corporations of interest, such as the individuals who sit on multiple
boards. You can use a statistical graph in combination with the network
graph in order to produce a subnetwork of the data. The result is
a network graph that shows individuals who sit on four or more different
boards.
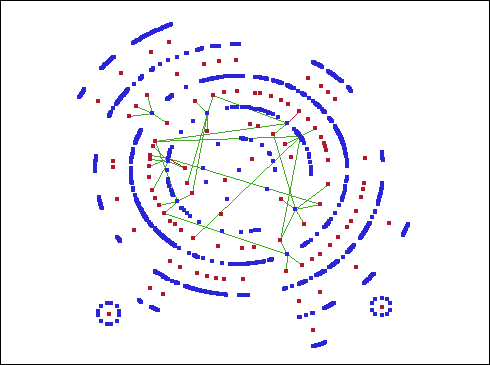
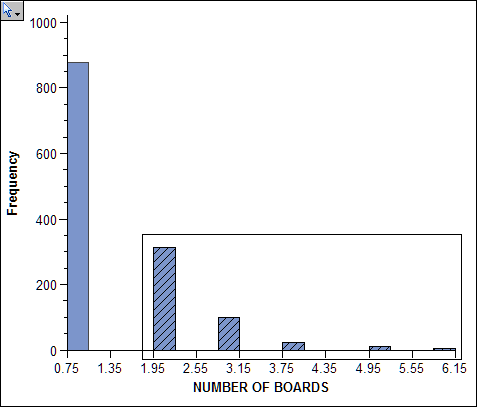
In this
graph, you can see that nine individuals sit on four or more different
boards. There are nine blue nodes that connect with four or more red
nodes. Two of these directors sit on five boards, and one director
sits on six different boards. These patterns suggest possible relationships
between companies that might not be readily apparent.
Detecting Interlocks
According
to Investor Responsibility Research Center’s (IRRC) definition,
there is an interlock when two CEOs sit on the boards of each other’s
companies. Interlocks are often viewed with a degree of suspicion;
therefore, it's important to identify interlocks in the network. The
subnetwork of interlocks is shown in the following figure. Here you
can see there are two interlocks:
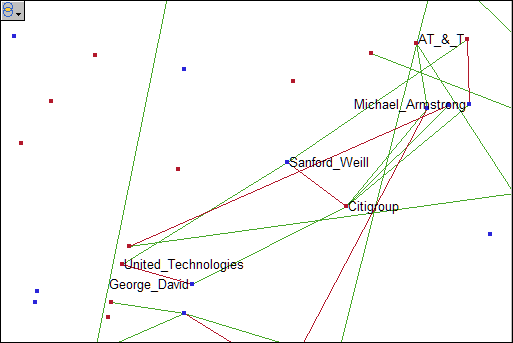
A quadrilateral
consisting of two CEOs and two corporations represents an interlock.
The interlocks can be detected by finding the quadrilaterals in this
much sparser subnetwork.
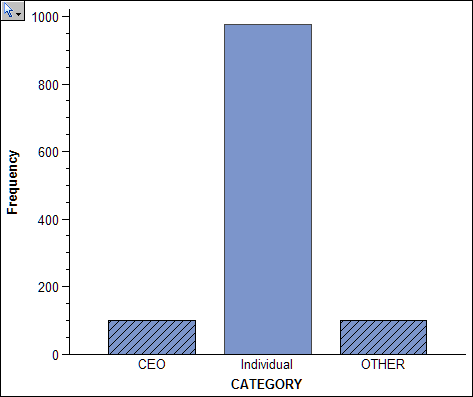
You can
use a statistical graph and the local selection feature to filter
the data in the network graph.
The following
figure shows the result of using a bar chart with local selection
mode to parse the visualized data. In this graph, links are visible
only for CEOs who sit on two or more boards.
In summary,
this example shows how to use SAS/GRAPH Network Visualization Workshop
to identify relationships between directors and the boards on which
they sit. You first identified individuals who sit on four or more
different boards. Then you identified CEOs who sit on the boards of
each other’s companies.