Example Use Case: Web Path Data

Introduction to the Web Path Data Example

This example describes how to use SAS/GRAPH Network Visualization Workshop to investigate Web path data. The data used here represents Web paths that users follow when they browse Web pages on an intranet. The data has information about different Web pages (nodes) that users visited and the paths (links) that users followed after visiting a page.
A visualization of this data is shown in the following figure. The nodes other than green are the nodes that are visited the most. The nodes connecting frequently followed links are kept close to each other, and these nodes form the cluster of links at the center of the hexagon.
Web path network

Open the Web Path Data Project

To open the project:
  1. Open the WebPathData.nvw project, which is located in the Samples\Projects subdirectory of your installation.
    This project automatically loads the node and link data sets. The project also loads the hexagonal network graph that you examine in this example.
  2. Select Datathen selectEdit Attributes. The Edit Data Attributes dialog box opens. Set or make sure that the attributes have been set as indicated here:
    Link Attributes
    Select ID1 from the From list box.
    Select ID2 from the To list box.
    Select COUNT from the Color list box.
    Node Attributes
    Select ID from the ID list box.
    Leave the Shape list box set to <None>.
    Select COUNT from the Color list box.
    Select VALUE from the Label list box.
  3. Select Viewthen selectStylethen selectDefault to use the Default style that is seen in this example.

About the Data Used in the Example

The data for this example is contained in two data sets: a node data set (webpath_nodes.sas7bdat) and a link data set (webpath_links.sas7bdat).
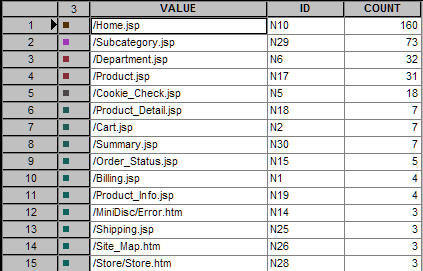
The following figure shows a portion of the node data set:
Node Data Set (webpath_nodes.sas7bdat)
Web path node data set
The following table summarizes the variables in this data set that are relevant to the example:
Node Variables for the Web Path Sample
Variable
Description
ID
Provides a unique ID for each Web page. This variable serves as the Node ID variable in the Edit Data Attributes dialog box.
COUNT
Represents the number of hits for the particular Web page. This variable is set as the color attribute in the Edit Data Attributes dialog box and, therefore, determines node colors.
VALUE
Represents the actual Web page name.
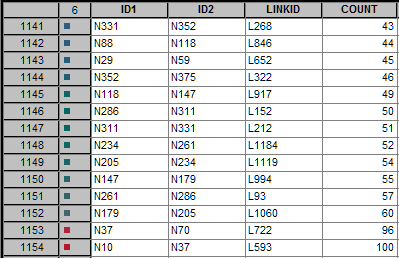
The following figure shows a portion of the link data set:
Link Data Set (webpath_links.sas7bdat)
Webpath link data set
The following table summarizes the variables in this data set:
Link Variables for the Web Path Sample
Variable
Description
ID1
Serves as the FROM variable that originates the link. Data values can be found in the ID variable of the node data set.
ID2
Serves as the TO variable that terminates the link. Data values can be found in the ID variable of the node data set.
LINKID
Represents the ID for a link.
COUNT
Indicates the number of times the particular path (ID1 to ID2) is followed. This variable acts as a weight for the links.
This variable is set as the color attribute in the Edit Data Attributes dialog box and, therefore, determines link colors.
Note: The From and To variables are not shown in the figure or included in the previous table. These variables are automatically generated, zero-based indexes into the node data set.

Identifying the Most Popular Web Sites

You can use statistical graphs in combination with the network graph in order to produce a subnetwork of the data. The result is a network graph that shows frequently followed links and nodes with the maximum number of visits.
Most Popular Web Sites
Network Graph that Shows the Most Popular Web sites
The following steps describe how to create this graph:
  1. Click the node data table to activate it.
  2. Create a histogram using the Graphsthen selectHistogram menu option. Select COUNT as the X variable. Leave the default <Frequency> for the Y variable.
  3. In the histogram, select the bars with an X value greater than or equal to 30. Hold the CTRL key to make multiple selections. Alternatively, drag a rectangle around the bars that you want to select.
    The following figure shows the histogram with the bars selected:
    Nodes with a Count of 30 or More
    Node Histogram with Nodes with a Count of 30 or More
  4. Click the link data table to activate it.
  5. Create a histogram using the Graphsthen selectHistogram menu option. Select COUNT as the X variable. Leave the default <Frequency> for the Y variable.
  6. In the histogram, select the bars with an X value greater than or equal to 12. Hold the CTRL key to make multiple selections. Alternatively, drag a rectangle around the bars that you want to select.
    The following figure shows the histogram with the bars selected:
    Links with a Count of 12 or More
    Link Histogram with Links with a Count of 12 or More
  7. Select Toolsthen selectInteractive Zoom. Then click the network graph to zoom in on the graph.
  8. If you want to see the names of the Web pages, select Toolsthen selectLabel, and then click the nodes in the network graph.