Example Use Case: Credit Card Fraud

Introduction to the Credit Card Fraud Example

This example describes how to use SAS/GRAPH Network Visualization Workshop to investigate patterns of credit card fraud. The data used here represent a sampling 
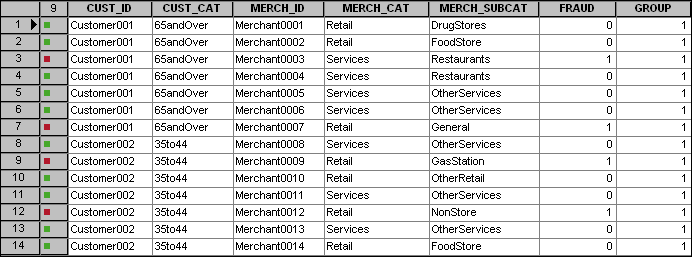
from a large credit card transaction database. All transactions included here, both valid and fraudulent, relate to customers with at least one fraudulent credit card transaction.
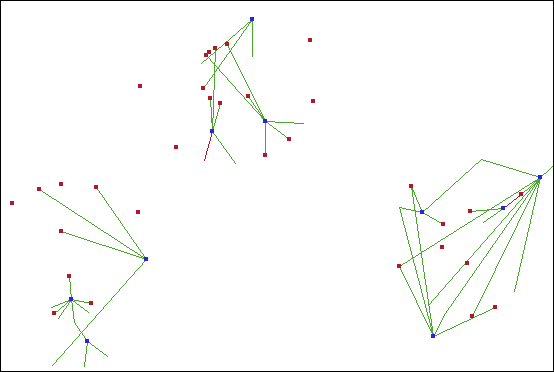
A visualization of this data is shown in the following figure. The blue nodes in the network correspond to merchants, and the red nodes correspond to customers. Each link represents a transaction between a customer and a merchant. The green links correspond to valid transactions, whereas the red links correspond to fraudulent transactions. (Remember that all links pertain to customers with at least one fraudulent credit card transaction in the database.)
Credit Card Transaction Network
Credit card fraud network graph
As you can see from the figure, this example uses a lot of data. The goal of this example is to examine this large amount of data in order to detect patterns of credit card fraud.

Open the Credit Card Fraud Project

To open the project:
  1. Open the ccFraudData.nvw project, which is located in the Samples\Projects subdirectory of your installation.
    This project automatically loads the node and link data sets. The project also loads the hierarchical network graph that you examine in this example.
  2. Select Datathen selectEdit Attributes, and set or make sure that the attributes have been set as indicated here:
    Link Attributes
    Select CUST_ID from the From list box.
    Select MERCH_ID from the To list box.
    Select FRAUD from the Color list box.
    Node Attributes
    Select NODE_ID from the ID list box.
    Leave the Shape list box set to <None>.
    Select TYPE from the Color list box.
    Select NODE_ID from the Label list box.
Note: This example describes the default settings for the ccFraudData project. If you have made changes earlier to this project, then your settings might differ from those described here. For example, if you have applied a different style (other than Default), then your nodes and links will have different colors.

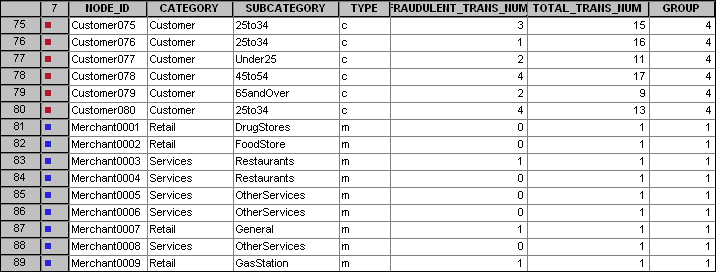
About the Data Used in the Example

The data for this example is contained in two data sets: a node data set (ccnodes.sas7bdat) and a link data set (cclinks.sas7bdat).
The following figure shows a portion of the node data set:
Node Data Set (ccnodes.sas7bdat)
Credit card fraud node data set
The following table summarizes the variables in this data set:
Variable
Description
NODE_ID
Lists the names of the customers and merchants. This variable serves as the Node ID variable in the Edit Data Attributes dialog box.
CATEGORY
Classifies the merchants (along with SUBCATEGORY).
SUBCATEGORY
Classifies the customers. Provides a second-level classification for merchants.
TYPE
Indicates whether the node is a customer (c) or merchant (m). This variable also determines the colors of the node markers.
FRAUDULENT_TRANS_NUM
Provides the number of fraudulent transactions.
TOTAL_TRANS_NUM
Provides the total number of transactions.
GROUP
Provides an additional grouping in order to facilitate examination of the data.
The following figure shows a portion of the link data set:
Link Data Set (cclinks.sas7bdat)
Credit card fraud link data set
The following table summarizes the variables in this data set:
Variable
Description
CUST_ID
Serves as the FROM variable in the Edit Data Attributes dialog box. Data values can be found in the NODE_ID variable of the node data set.
CUST_CAT
Indicates the customer classification data values. These values are taken from the SUBCATEGORY variable of the node data set.
MERCH_ID
Serves as the TO variable in the Edit Data Attributes dialog box. Data values can be found in the NODE_ID variable of the node data set.
MERCH_CAT; MERCH_SUBCAT
Indicates the merchant classification data values. These values are taken from the CATEGORY and the SUBCATEGORY variables of the node data set.
FRAUD
Indicates whether the transaction is fraudulent (1) or not fraudulent (0). This variable also determines link colors.
GROUP
Provides an additional grouping in order to facilitate examination of the data.
Note: The From Index and To Index variables are not shown in the figure or included in the previous table. These variables are automatically generated, zero-based indexes into the node data set.

Determining Your Strategy

One scenario for credit card fraud involves employees who work for the merchants in our data sets. In this scenario, the employee steals customer credit card numbers and either uses them or sells the numbers. The fraudulent transaction is typically not directly associated with the merchant where the employee works. Instead, the fraudulent transaction is connected to another merchant through a common customer with the original merchant. In a network graph, the fraudulent links (depicted in red here) are typically one link removed from the problem merchant. Therefore, rather than focus on fraudulent transactions, you will look at merchants with a significant number of customers. Keep in mind that all customers in the data set experienced at least one fraudulent transaction. A merchant that has connections with many customers in the transaction network raises suspicions of fraud. Although this approach is not proof of fraud, it identifies specific merchants that had access to customer credit card numbers that have fraudulent transactions associated with them. These merchants warrant further investigation.
The degree of a node is the number of links having that node as an endpoint. In this example, the degree of a merchant is the number of customers that had a transaction with the merchant. The goal, then, is to identify merchants with high degree, which is defined here as greater than or equal to three.

Identifying Suspicious Merchants

Examine Merchants in Group 1
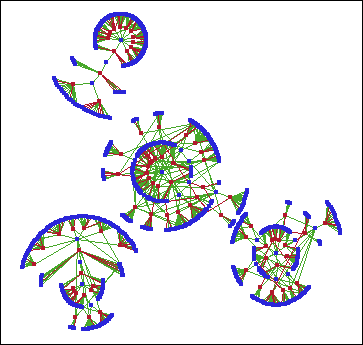
The subnetwork in the upper left portion of the network graph contains transactions between merchants and customers that are in Group 1. The following figure magnifies and shows this subnetwork.
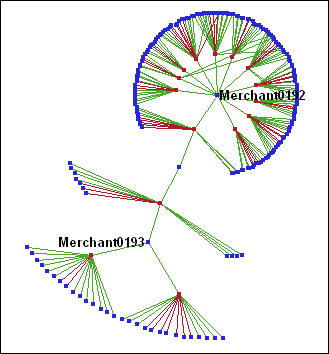
Subnetwork of Transactions in Group 1
Subnetwork of transactions in Group 1
The simplicity of this subnetwork enables you to identify the merchants with high degree by direct observation. (Keep in mind that blue markers represent merchants, and red markers represent customers.) When you apply labels to the merchants with high degree, you can identify these merchants as Merchant0192 and Merchant0193 with a degree of 11 and 3, respectively.

Examine the Remaining Merchants

For the remaining three clusters in the network graph, the density of the subnetworks makes it difficult to detect all the merchants with high degree using direct observation. You can use a statistical graph and the local selection feature to filter the data in the network graph.
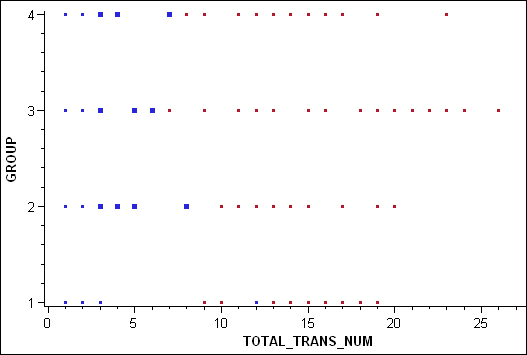
The following figure shows the result of using a scatter plot with local selection mode to parse the visualized data. In this graph, the blue nodes that are visible represent all the merchants with high degree in groups 2, 3, and 4.
Merchants with High Degree in Groups 2, 3, and 4
Network graph that shows only blue nodes with high degree
The following steps describe how to create this graph in the ccFraudData.nvw project:
  1. Click the node data table to activate it.
  2. Create a scatter plot using the Graphsthen selectScatter Plot menu option. Select TOTAL_TRANS_NUM as the X variable and GROUP as the Y variable.
  3. In the scatter plot, select the merchants with high degree in groups 2, 3, and 4. To do this, select all blue nodes with an X coordinate greater than or equal to 3 and a Y coordinate greater than or equal to 2. Hold the CTRL key to select multiple nodes.
    The following figure shows the scatter plot with the merchants selected:
    Scatter Plot with Some Merchants Selected
    Scatter plot with some merchants selected
  4. Select Datathen selectSelection Modethen selectLocal. An icon is displayed in the upper left corner of each graph. The icon for the network graph (Observer union icon) indicates that the graph has an observer-union role.
  5. In the scatter plot, select all customers (all red nodes) with a Y coordinate greater than or equal to 2. The customer nodes appear in the network graph.
    In the network graph, the blue nodes that are visible represent all the merchants in groups 2, 3, and 4 that have high degree.
  6. Select Tools then selectInteractive Zoom. Then click the network graph to zoom in on the graph.
  7. If you want to see the names of the merchants, select Toolsthen selectLabel, and then click the blue nodes in the network graph.
In summary, this example shows how to use SAS/GRAPH Network Visualization Workshop to investigate credit card fraud. You used the visualization features and observation filtering capabilities to identify merchants that warrant additional scrutiny with regard to fraudulent credit card transactions.