GBARLINE Procedure

About Midpoints
Character Values
Continuous Numeric Values
A continuous numeric variable generates
midpoints that represent ranges of values. By default, the GBARLINE
procedure determines the number of uniform ranges (LEVELS), calculates
the number of observations in each range, and then computes the TYPE=
statistic based on this frequency. A value that falls exactly on
a range boundary is placed in the higher range.
Selecting and Ordering Midpoints
For character or discrete numeric
values, you can use the MIDPOINTS= option to rearrange the midpoints
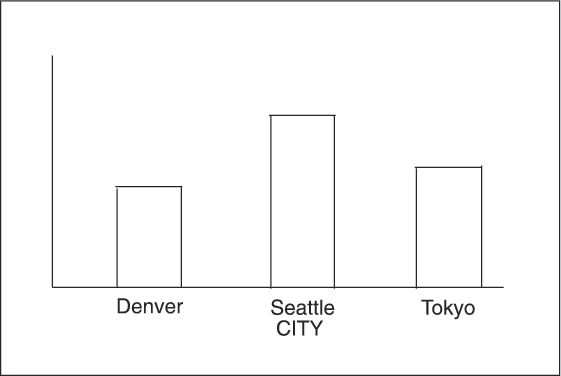
or to exclude midpoints from the chart. For example, to
change the default alphabetic order of the midpoints in Character Midpoints, specify the
following midpoints:
midpoints="Tokyo" "Denver" "Seattle"
In this case, values
excluded by the option are not included in the calculation of the
chart statistic.
You can order or select
discrete numeric midpoint values just as you do character values,
but you omit the quotation marks when specifying numeric values.
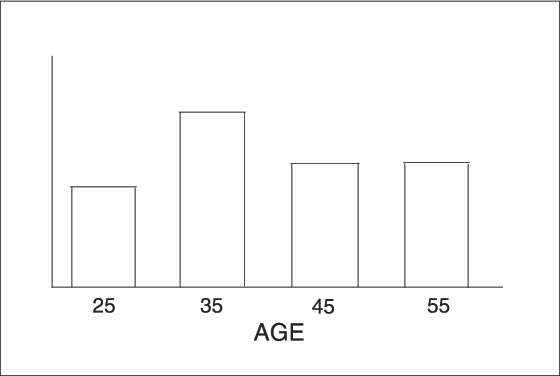
For continuous numeric
variables, use the LEVELS= or MIDPOINTS= option to change the number
of midpoints. These options can also control the range of values each
midpoint represents or change the order of the midpoints. To control
the range of values each midpoint represents, use the MIDPOINTS= option
to specify the midpoint value of each range. For example, to select
the ranges 20–29, 30–39, and 40–49, specify the
following values:
midpoints=25 35 45;
Alternatively, to select
the number of midpoints that you want and let the procedure calculate
the ranges and midpoints, use the LEVELS= option.
You can also use formats
to control the ranges of continuous numeric variables, but in that
case the values are no longer continuous but become discrete.
Note: You cannot use the MIDPOINTS=
option to exclude continuous numeric values from the chart. This is
because values below or above the ranges specified by the option are
automatically included in the first and last midpoints. To exclude
continuous numeric values from a chart, use a WHERE statement in a
DATA step or the WHERE= data set option.