GBARLINE Procedure

About Bar-Line Charts
The GBARLINE procedure produces a bar chart based on
the values of a chart variable and an optional response variable (SUMVAR=
option). The computed statistic can be set with the TYPE= option.
Each line plot uses the same chart variable and has an optional response
variable (SUMVAR= option). A computed statistic can be set with the
TYPE= option.
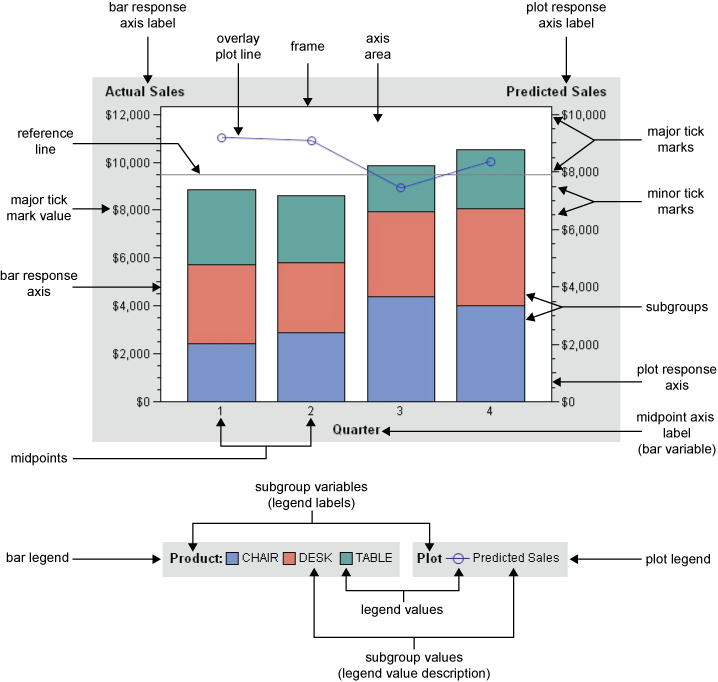
Parts of a Bar-Line Chart illustrates
the parts of a bar-line chart.
Bar-line
charts have three axes:
The response axes are divided into evenly spaced
intervals identified with major tick marks that are labeled with the
corresponding statistic value. Minor tick marks are evenly distributed
between the major tick marks. Each axis is labeled with the variable
name or label. The right response axis is scaled to accommodate all
the line variable response values when multiple PLOT statements are
present.