G3GRID Procedure

Example 1: Using the Default Interpolation Method
| Features: |
G3GRID statement option OUT= GRID statement options AXIS1= and AXIS2= |
| Other features: |
DATA step and the G3D procedure |
| Sample library member: | GTGDEFIN |
This example demonstrates
the default interpolation method that is used by the GRID statement.
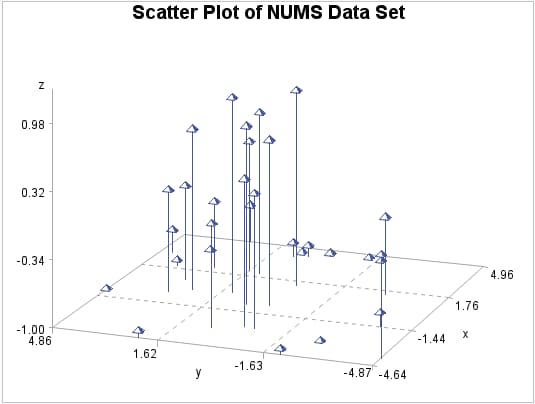
The example first generates a scatter plot of random data to show
the concentration of data values before processing the data set with
the G3GRID procedure. The original data does not contain enough combinations
of x, y, and z values to generate
a surface plot with the G3D procedure or generate a contour plot with
the GCONTOUR procedure.
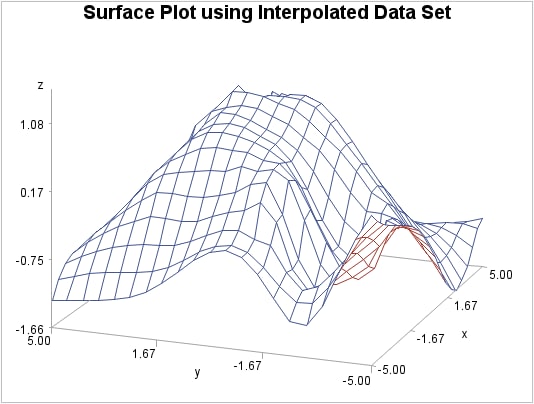
The example then runs
the G3GRID procedure to interpolate additional x, y,
and z values. Because no interpolation
method is specified, the default interpolation method is used. The
resulting output data set is used as input to the G3D procedure, which
generates the surface plot shown in the following output.
Surface Plot Using Interpolated Data Set (gtgdefin)
Program
goptions reset=all border;
data nums;
   keep x y z;
   do i=1 to 30;
      x=10*ranuni(33)-5;
      y=10*ranuni(35)-5;
      z=sin(sqrt(x*x+y*y));
      output;
   end;
run;
title "Scatter Plot of NUMS Data Set";
proc g3d data=nums;
   scatter y*x=z;
   run;
quit;
proc g3grid data=nums out=default;
   grid y*x=z /
      axis1=-5 to 5 by .5
      axis2=-5 to 5 by .5;
   run;
quit;
title "Surface Plot using Interpolated Data
Set";
proc g3d data=default;
   plot y*x=z;
run;
quit;
Program Description
Create data set. NUMS uses
a set of randomly sampled points to create the data used in this,
and all remaining examples in this chapter.
data nums;
   keep x y z;
   do i=1 to 30;
      x=10*ranuni(33)-5;
      y=10*ranuni(35)-5;
      z=sin(sqrt(x*x+y*y));
      output;
   end;
run;Grid the data with PROC G3GRID. The OUT= option on PROC G3GRID specifies a name
for the temporary output data set. The GRID option specifies the variables
Y*X=Z for the output data set. The AXIS statements define axes ranges.