GCONTOUR Procedure

Example 1: Simple Contour Plot
| Features: |
PLOT statement |
| Data set: | SASHELP.LAKE |
| Sample library member: | GCTLAKE |
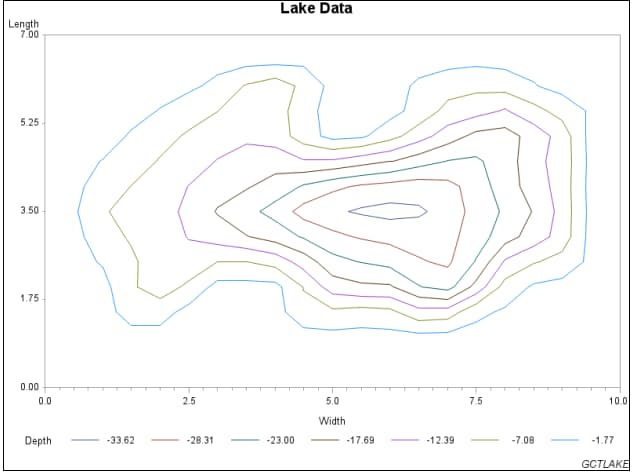
This simple contour
plot displays the various depths of a lake. The dimensions of the
lake are plotted on the x and y axes.
The z variable is plotted as
the third dimension, as levels represented by contour lines. The contour
line levels are displayed and labeled in the legend.
Program
goptions reset=all border;
title "Lake Data";
footnote j=r "GCTLAKE";
proc gcontour data=sashelp.lake;
    plot length*width=depth;
run;
quit;