The VARMAX Procedure
- Overview
-
Getting Started

-
Syntax
-
Details
Missing Values VARMAX Model Dynamic Simultaneous Equations Modeling Impulse Response Function Forecasting Tentative Order Selection VAR and VARX Modeling Bayesian VAR and VARX Modeling VARMA and VARMAX Modeling Model Diagnostic Checks Cointegration Vector Error Correction Modeling I(2) Model Multivariate GARCH Modeling Output Data Sets OUT= Data Set OUTEST= Data Set OUTHT= Data Set OUTSTAT= Data Set Printed Output ODS Table Names ODS Graphics Computational Issues
-
Examples
- References
| Parameter Estimation and Testing on Restrictions |
In the previous example, the VARX(1,0) model is written as
 |
with
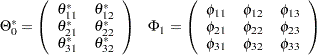 |
In Figure 35.20 of the preceding section, you can see several insignificant parameters. For example, the coefficients XL0_1_2, AR1_1_2, and AR1_3_2 are insignificant.
The following statements restrict the coefficients of  for the VARX(1,0) model.
/*--- Models with Restrictions and Tests ---*/

proc varmax data=grunfeld;
   model y1-y3 = x1 x2 / p=1 print=(estimates);
   restrict XL(0,1,2)=0, AR(1,1,2)=0, AR(1,3,2)=0;
run;
The output in Figure 35.21 shows that three parameters  ,
,  , and
, and  are replaced by the restricted values, zeros. In the schematic representation of parameter estimates, the three restricted parameters , , and are replaced by
  .
.
| XLag | |||
|---|---|---|---|
| Lag | Variable | x1 | x2 |
| 0 | y1 | 1.67592 | 0.00000 |
| y2 | -6.30880 | 2.65308 | |
| y3 | -0.03576 | -0.00919 | |
| AR | ||||
|---|---|---|---|---|
| Lag | Variable | y1 | y2 | y3 |
| 1 | y1 | 0.27671 | 0.00000 | 0.01747 |
| y2 | -2.16968 | 0.10945 | -0.93053 | |
| y3 | 0.96398 | 0.00000 | 0.93412 | |
| Schematic Representation | |||
|---|---|---|---|
| Variable/Lag | C | XL0 | AR1 |
| y1 | . | +* | .*. |
| y2 | + | .+ | ..- |
| y3 | - | .. | +*+ |
| + is > 2*std error, - is < -2*std error, . is between, * is N/A | |||
The output in Figure 35.22 shows the estimates of the Lagrangian parameters and their significance. Based on the  -values associated with the Lagrangian parameters, you cannot reject the null hypotheses
  ,
,  , and
, and  with the 0.05 significance level.
| Testing of the Restricted Parameters | ||||
|---|---|---|---|---|
| Parameter | Estimate | Standard Error |
t Value | Pr > |t| |
| XL0_1_2 | 1.74969 | 21.44026 | 0.08 | 0.9389 |
| AR1_1_2 | 30.36254 | 70.74347 | 0.43 | 0.6899 |
| AR1_3_2 | 55.42191 | 164.03075 | 0.34 | 0.7524 |
The TEST statement in the following example tests  and for the VARX(1,0) model:
proc varmax data=grunfeld;
   model y1-y3 = x1 x2 / p=1;
   test AR(1,3,1)=0;
   test XL(0,1,2)=0, AR(1,1,2)=0, AR(1,3,2)=0;
run;
The output in Figure 35.23 shows that the first column in the output is the index corresponding to each TEST statement. You can reject the hypothesis test at the 0.05 significance level, but you cannot reject the joint hypothesis test at the 0.05 significance level.
| Testing of the Parameters | |||
|---|---|---|---|
| Test | DF | Chi-Square | Pr > ChiSq |
| 1 | 1 | 150.31 | <.0001 |
| 2 | 3 | 0.34 | 0.9522 |