| The EXPAND Procedure |
Example 14.3 Interpolating Irregular Observations
This example shows the interpolation of a series of values measured at irregular points in time. The data are hypothetical. Assume that a series of randomly timed quality control inspections are made and defect rates for a process are measured. The problem is to produce two reports: estimates of monthly average defect rates for the months within the period covered by the samples, and a plot of the interpolated defect rate curve over time.
The following statements read and print the input data, as shown in Output 14.3.1.
data samples;
  input date : date9. defects @@;
  label defects = "Defects per 1000 Units";
  format date date9.;
datalines;

   ... more lines ...
title "Sampled Defect Rates";
proc print data=samples;
run;
To compute the monthly estimates, use PROC EXPAND with the TO=MONTH option and specify OBSERVED=(BEGINNING,AVERAGE). The following statements interpolate the monthly estimates.
proc expand data=samples
            out=monthly
            to=month
            plots=(input output);
  id date;
  convert defects / observed=(beginning,average);
run;
The following PROC PRINT step prints the results, as shown in Output 14.3.2.
title "Estimated Monthly Average Defect Rates";
proc print data=monthly;
run;
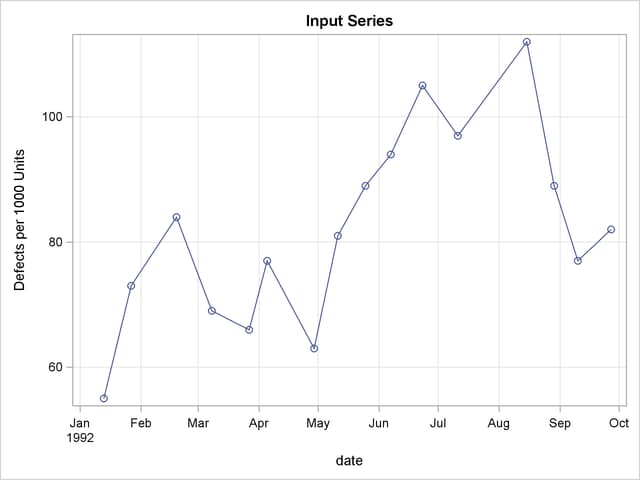
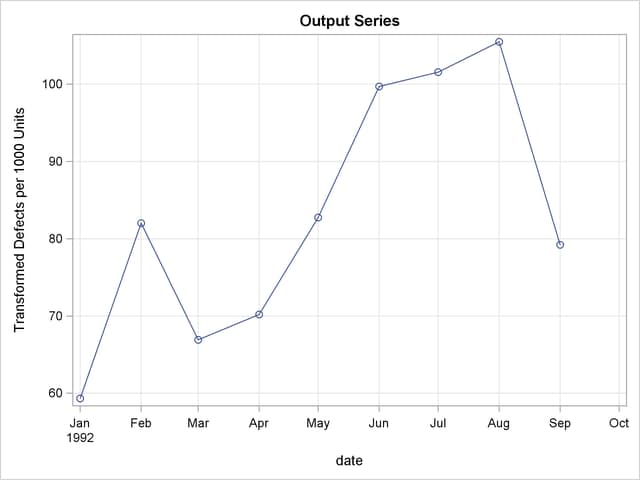
The plots produced by PROC EXPAND are shown in Output 14.3.3.
Copyright © SAS Institute, Inc. All Rights Reserved.