| The EXPAND Procedure |
Example 14.2 Illustration of ODS Graphics
This example illustrates the use of ODS graphics with PROC EXPAND.
The graphical displays are requested by specifying the ods graphics on; statement and specifying the PLOTS= option in the PROC EXPAND statement. For information about the graphics available in the EXPAND procedure, see the section ODS Graphics.
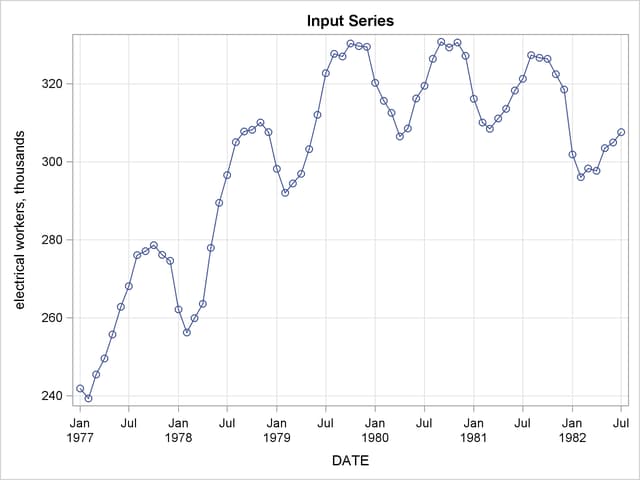
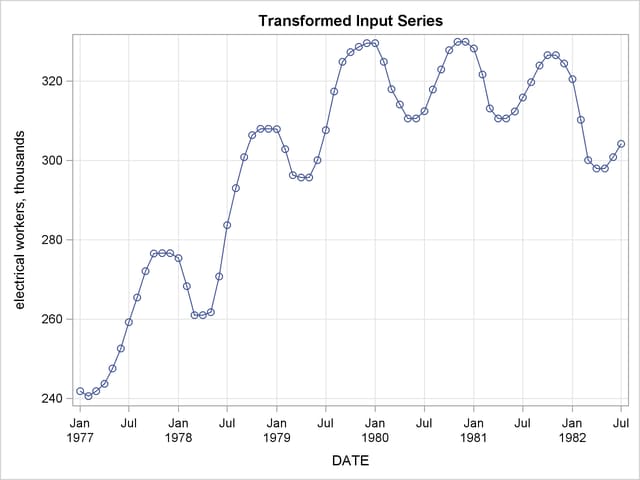
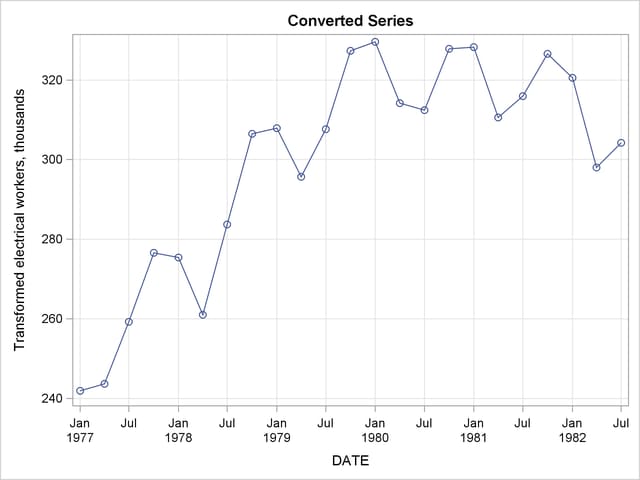
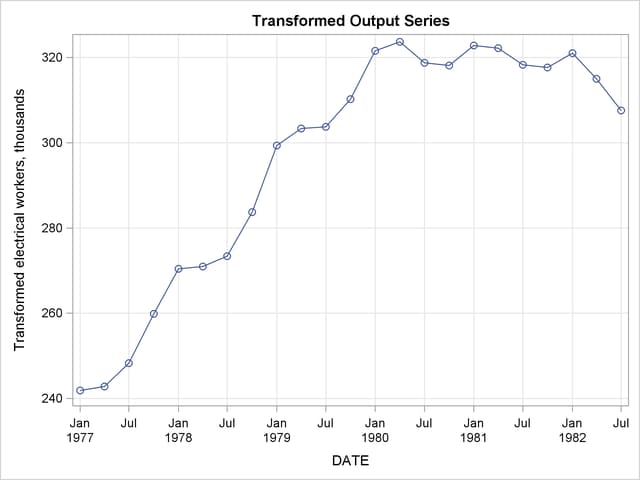
The following statements utilize the SASHELP.WORKERS data set to convert the time series of electrical workers from monthly to quarterly frequency and display ODS graphics plots. The PLOTS=ALL option is specified to request the plots of the input series, the transformed input series, the converted series, and the transformed output series. Figure 14.2.1 through Figure 14.2.4 show these plots.
proc expand data=sashelp.workers out=out
            from=month to=qtr
            plots=all;
   id date;
   convert electric=eout / method=spline
                           transformin=(movmed 4)
                           transformout=(movave 3);
run;
Copyright © SAS Institute, Inc. All Rights Reserved.