| The COUNTREG Procedure |
Example 10.1 Basic Models
Data Description and Objective
The data set docvisit contains information for approximately 5,000 Australian individuals about the number and possible determinants of doctor visits that were made during a two-week interval. This data set contains a subset of variables taken from the Racd3 data set used by Cameron and Trivedi (1998).
The variable doctorco represents doctor visits. Additional variables in the data set that you want to evaluate as determinants of doctor visits include sex (coded 0=male, 1=female), age (age in years divided by 100, with more than 70 coded as 72), illness (number of illnesses during the two-week interval, with five or more coded as five), income (annual income in Australian dollars divided by 1,000), and hscore (a general health questionnaire score, where a high score indicates bad health). Summary statistics for these variables are computed in the following statements and presented in Output 10.1.1. In the rest of this example some possible applications of the COUNTREG procedure in this context are presented.
   proc means data=docvisit;
      var doctorco sex age illness income hscore;
   run;
| Variable | N | Mean | Std Dev | Minimum | Maximum | ||||||||||||||||||||||||||||||||||||
|---|---|---|---|---|---|---|---|---|---|---|---|---|---|---|---|---|---|---|---|---|---|---|---|---|---|---|---|---|---|---|---|---|---|---|---|---|---|---|---|---|---|
|
|
|
|
|
|
Poisson Models
These statements fit a Poisson model to the data by using the covariates SEX, ILLNESS, INCOME, and HSCORE:
    /*-- Poisson Model --*/
    proc countreg data=docvisit;
       model doctorco=sex illness income hscore / dist=poisson printall;
    run;
In this example, the DIST= option in the MODEL statement specifies the POISSON distribution. In addition, the PRINTALL option displays the correlation and covariance matrices for the parameters, log-likelihood values, and convergence information in addition to the parameter estimates. The parameter estimates for this model are shown in Output 10.1.2.
| Parameter Estimates | |||||
|---|---|---|---|---|---|
| Parameter | DF | Estimate | Standard Error | t Value | Approx Pr > |t| |
| Intercept | 1 | -1.855552 | 0.074545 | -24.89 | <.0001 |
| sex | 1 | 0.235583 | 0.054362 | 4.33 | <.0001 |
| illness | 1 | 0.270326 | 0.017080 | 15.83 | <.0001 |
| income | 1 | -0.242095 | 0.077829 | -3.11 | 0.0019 |
| hscore | 1 | 0.096313 | 0.009089 | 10.60 | <.0001 |
Suppose that you suspect that the population of individuals can be viewed as two distinct groups: a low-risk group, comprising individuals who never go to the doctor, and a high-risk group, comprising individuals who do go to the doctor. You might suspect that the data have this structure both because the sample variance of DOCTORCO (0.64) exceeds its sample mean (0.30), which suggests overdispersion, and because a large fraction of the DOCTORCO observations (80%) have the value zero. Estimating a zero-inflated model is one way to deal with overdispersion that results from excess zeros.
Suppose also that you suspect that the covariate AGE has an impact on whether an individual belongs to the low-risk group. For example, younger individuals might have illnesses of much lower severity when they do get sick and be less likely to visit a doctor, all else being equal. The following statements estimate a zero-inflated Poisson regression with AGE as a covariate in the zero-generation process:
    /*-- Zero-Inflated Poisson Model --*/
    proc countreg data=docvisit;
       model doctorco=sex illness income hscore / dist=zip;
       zeromodel doctorco ~ age;
    run;
In this case, the ZEROMODEL statement following the MODEL statement specifies that both an intercept and the variable AGE be used to estimate the likelihood of zero doctor visits. Output 10.1.3 shows the resulting parameter estimates.
| Parameter Estimates | |||||
|---|---|---|---|---|---|
| Parameter | DF | Estimate | Standard Error | t Value | Approx Pr > |t| |
| Intercept | 1 | -1.033387 | 0.096973 | -10.66 | <.0001 |
| sex | 1 | 0.122511 | 0.062566 | 1.96 | 0.0502 |
| illness | 1 | 0.237478 | 0.019997 | 11.88 | <.0001 |
| income | 1 | -0.143945 | 0.087810 | -1.64 | 0.1012 |
| hscore | 1 | 0.088386 | 0.010043 | 8.80 | <.0001 |
| Inf_Intercept | 1 | 0.986557 | 0.131339 | 7.51 | <.0001 |
| Inf_age | 1 | -2.090923 | 0.270580 | -7.73 | <.0001 |
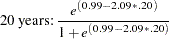
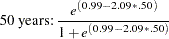
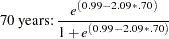
The estimates of the zero-inflated intercept (Inf_Intercept) and the zero-inflated regression coefficient for AGE (Inf_age) are approximately 0.99 and –2.09, respectively. Therefore, you can estimate the probabilities for individuals of ages 20, 50, and 70 as follows:
 |
 |
 |
|||
 |
|
 |
|||
 |
|
 |
That is, the estimated probability of belonging to the low-risk group is about 0.64 for a 20-year-old individual, 0.49 for a 50-year-old individual, and only 0.38 for a 70-year-old individual. This supports the suspicion that older individuals are more likely to have a positive number of doctor visits.
Alternative models to account for the overdispersion are the negative binomial and the zero-inflated negative binomial models, which can be fit using the DIST=NEGBIN and DIST=ZINB option, respectively.
Copyright © 2008 by SAS Institute Inc., Cary, NC, USA. All rights reserved.